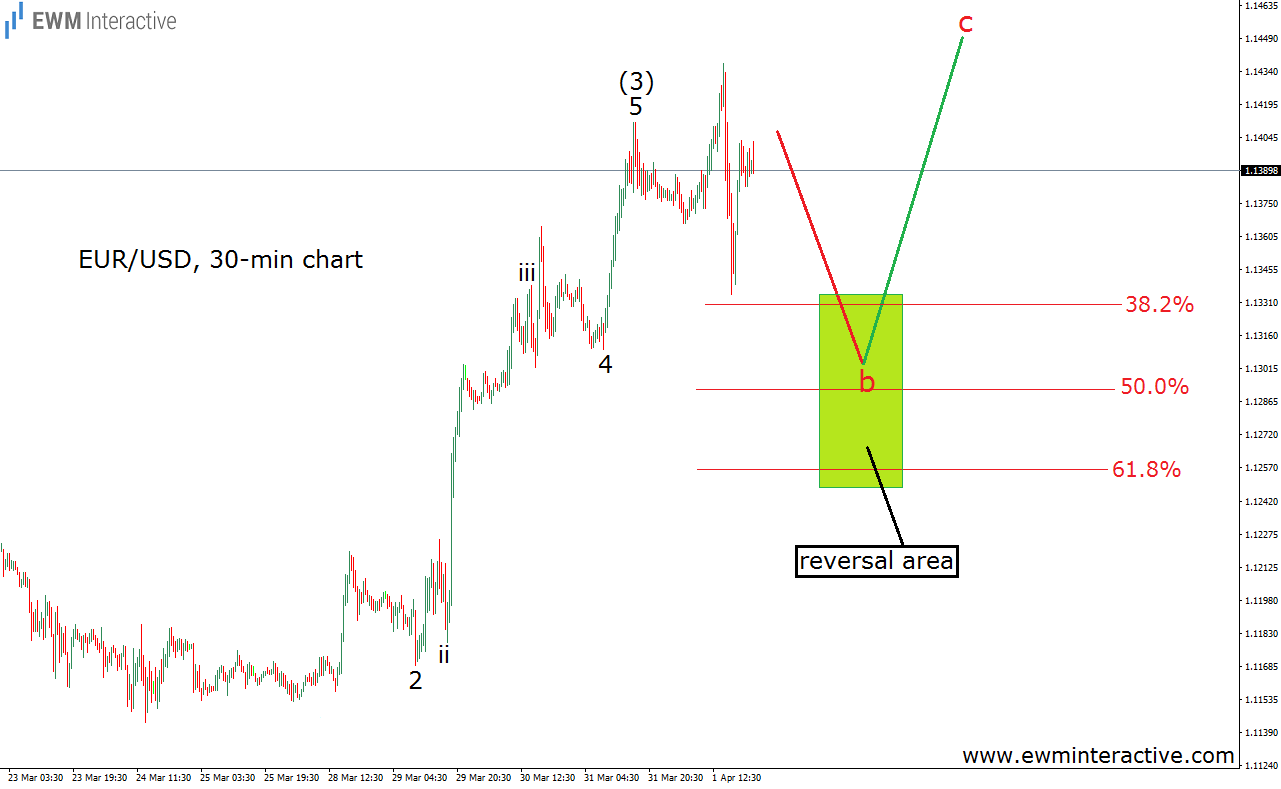
EUR/USD initially fell to 1.1326 last week, but then managed to return stronger and climb to 1.1453. There has been plenty of news during the last five trading days. From U.S. trade balance, through services ISM reports and FOMC minutes to initial jobless claims, mainstream analysts have been quite busy with trying to interpret all these pieces of information, in order to form an opinion. Fortunately, Elliott Wave analysts do not need to constantly look forward to the news. Because all an Elliottician needs is a chart and the Elliott Wave Principle. It could give traders a hint about the market’s intentions long before the majority has any idea. In order to prove our point, we will show you the forecast we sent to our premium clients on Monday, April 4th. It is given below. (some of the marks have been removed for this article)
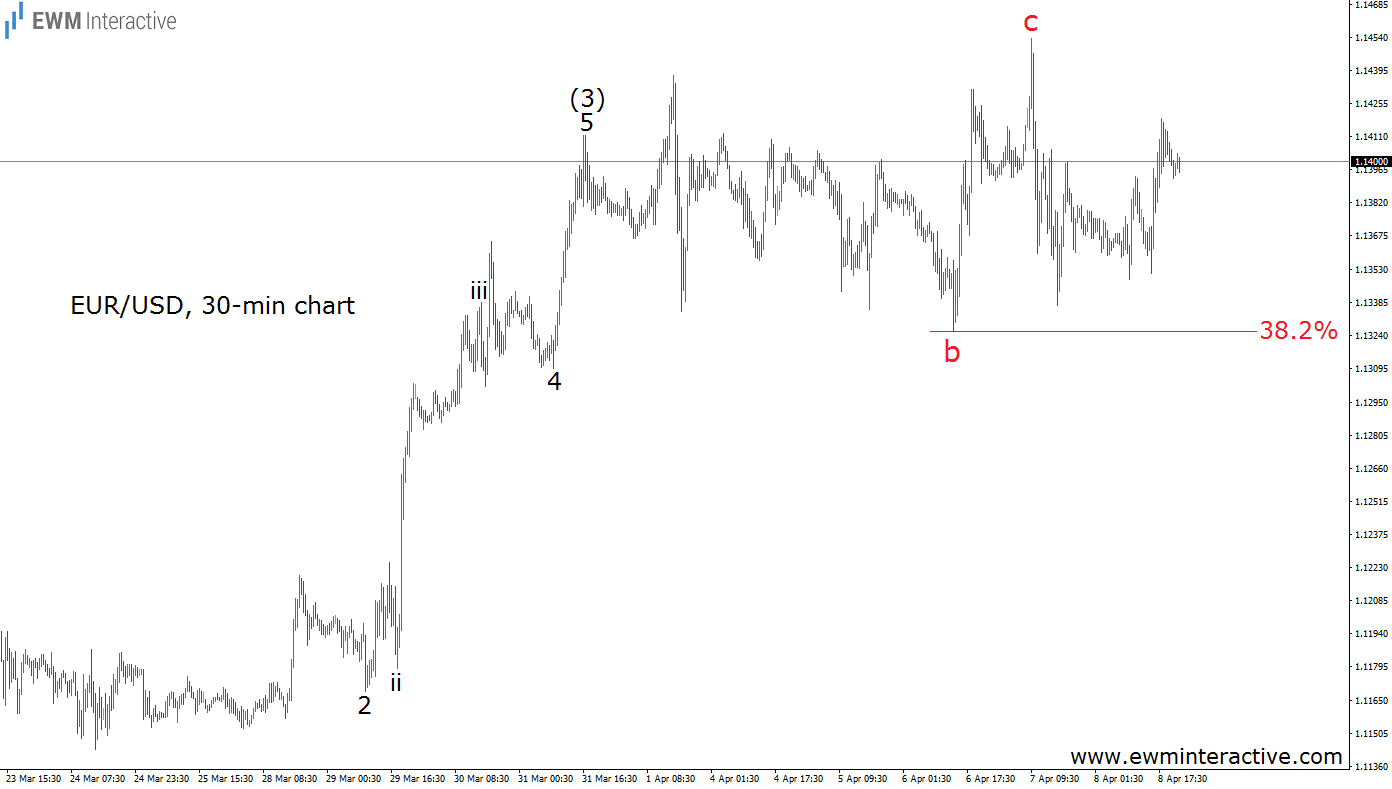
Part of the explanations our premium clients had the benefit to receive with that chart, was the following sentence: “Once wave “b” is over, wave “c” to the north could take EUR/USD above 1.1440.” As visible, we thought wave “b” was going to end soon after touching the 38.2% Fibonacci level and give the start to another rally towards 1.1440 or higher. With the week already behind us, let’s see how the situation has developed. An updated chart is given below.
Wave “b” ended precisely at the 38.2% retracement level. Then, the bulls returned and took EUR/USD to new highs. On Thursday, April 7th, the exchange rate rose to 1.1453, thus exceeding our target level. That is why we trust the Elliott Wave principle. It often allows us to predict more than just one single move and not only in FOREX, but in other markets as well. What would it take for you to give it a chance too?
- English (UK)
- English (India)
- English (Canada)
- English (Australia)
- English (South Africa)
- English (Philippines)
- English (Nigeria)
- Deutsch
- Español (España)
- Español (México)
- Français
- Italiano
- Nederlands
- Português (Portugal)
- Polski
- Português (Brasil)
- Русский
- Türkçe
- العربية
- Ελληνικά
- Svenska
- Suomi
- עברית
- 日本語
- 한국어
- 简体中文
- 繁體中文
- Bahasa Indonesia
- Bahasa Melayu
- ไทย
- Tiếng Việt
- हिंदी
Decoding EUR/USD With Elliott Wave
Published 04/10/2016, 12:54 AM
Updated 07/09/2023, 06:31 AM
Decoding EUR/USD With Elliott Wave
Latest comments
Loading next article…
Install Our App
Risk Disclosure: Trading in financial instruments and/or cryptocurrencies involves high risks including the risk of losing some, or all, of your investment amount, and may not be suitable for all investors. Prices of cryptocurrencies are extremely volatile and may be affected by external factors such as financial, regulatory or political events. Trading on margin increases the financial risks.
Before deciding to trade in financial instrument or cryptocurrencies you should be fully informed of the risks and costs associated with trading the financial markets, carefully consider your investment objectives, level of experience, and risk appetite, and seek professional advice where needed.
Fusion Media would like to remind you that the data contained in this website is not necessarily real-time nor accurate. The data and prices on the website are not necessarily provided by any market or exchange, but may be provided by market makers, and so prices may not be accurate and may differ from the actual price at any given market, meaning prices are indicative and not appropriate for trading purposes. Fusion Media and any provider of the data contained in this website will not accept liability for any loss or damage as a result of your trading, or your reliance on the information contained within this website.
It is prohibited to use, store, reproduce, display, modify, transmit or distribute the data contained in this website without the explicit prior written permission of Fusion Media and/or the data provider. All intellectual property rights are reserved by the providers and/or the exchange providing the data contained in this website.
Fusion Media may be compensated by the advertisers that appear on the website, based on your interaction with the advertisements or advertisers.
© 2007-2024 - Fusion Media Limited. All Rights Reserved.
