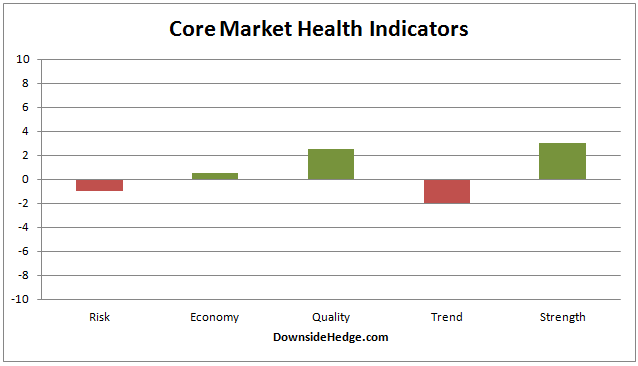
We end this week in a critical situation. My core indicators were all damaged during the high volatility moves both up and down this week. Core measures of risk and trend have now gone negative. The measures of the economy are close to going negative, and market quality and strength aren’t far behind. As a result, the core portfolios are raising cash and or adding a hedge. The new core allocations are as follows.
Long / Cash: 60% Long and 40% Cash
Long / Short: 80% Long stocks I believe will out perform in an uptrend — 20% short the S&P 500 Index (SPX)

My market risk indicator hasn’t signaled yet, so the volatility hedge will remain 100% Long.
So, what’s an investor to do? Follow the core portfolios or the volatility hedged portfolio? The answer lies in your risk tolerance. The volatility hedged portfolio is designed to ride out most dips in the market and only hedge when the odds for a steep decline rise. The core portfolios are more fluid and slowly change allocation based on the weight of evidence. As a result, the core portfolios warn earlier on declines, but often hedge during sideways consolidation periods that ultimately rally to new highs. Since we can’t see the future, we have to weigh our own risk tolerance against our willingness to pay for insurance (the hedge or raising cash). As always, I leave it to you to make decisions for your own portfolios.
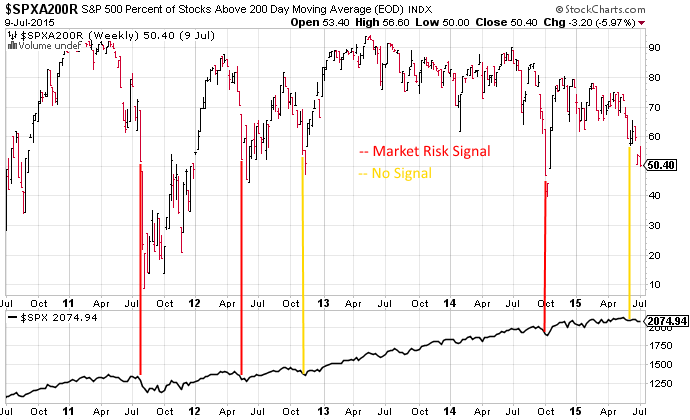
I mentioned above that this week is ending with the market at a critical point. There are several indicators that are at points that signal an acceleration of the decline or mark the lows. For example, let’s look at the percent of stocks in the S&P 500 index that are below their 200 day moving average and my market risk indicator. When more than 40% of stocks are below their 200 dma and my market risk indicator signals, there is often a decline greater than 5% still ahead of us. When there is no signal from the market risk indicator, but breadth is weak, the odds increase that the low is very near.
I suspect that next week we’ll have a decision from my market risk indicator based on how market participants react to Greece, China, and earning season. Let your personal risk tolerance determine if you want to hedge ahead of these events or wait to see if we get a risk warning.
