
Equities
- Recent AAII survey readings came in at 47% bulls and 28% bears. While this survey is more volatile the others, bullish readings have been quite elevated for major of the second half of the year. Therefore, the AAII bull ratio (4 week moving average) has also remained at or near bullish extremes. At the same time, AAII cash allocations remain extremely low, indicating that retail community is fully invested into stocks. For referencing, AAII bull ratio survey chart can been seen by clicking here, while last months AAII Cash Allocation survey chart can be seen by clicking clicking here.
Chart 1: Most bullish newsletter sentiment since 1987 market crash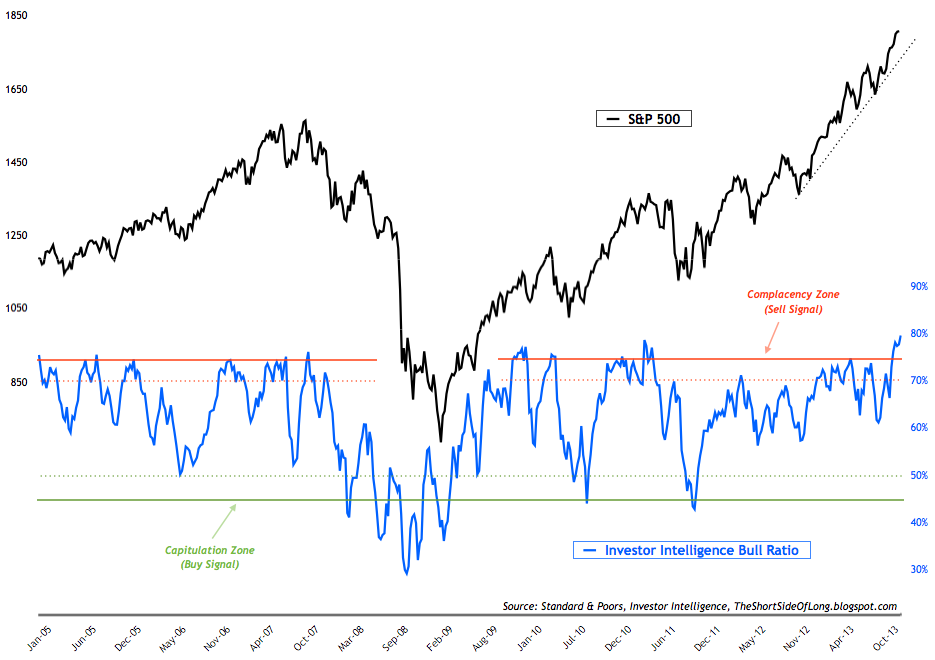
- Recent Investor Intelligence survey levels came in at 56% bulls and 14% bears. Bullish readings have remained above 50 for five weeks now, while bearish readings have now dropped the lowest level on record. With hardly any sellers left, and plethora of buyers, the chart above shows the II bull ratio at extreme levels, is giving us a very powerful sell signal.
- Recent NAAIM survey levels came in at 101% net long exposure (meaning managers are all in and then some), while the intensity was at 213%. Dissecting the survey shows that the more bullish managers hold 163% net long positions, while the more bearish managers actually hold no net shorts as they are also 50% net long. With such an extreme net long exposure, this is yet another clear sell signal. For referencing, NAAIM survey chart can been seen by clicking here.
Chart 2: Markets have entered yet another euphoria event...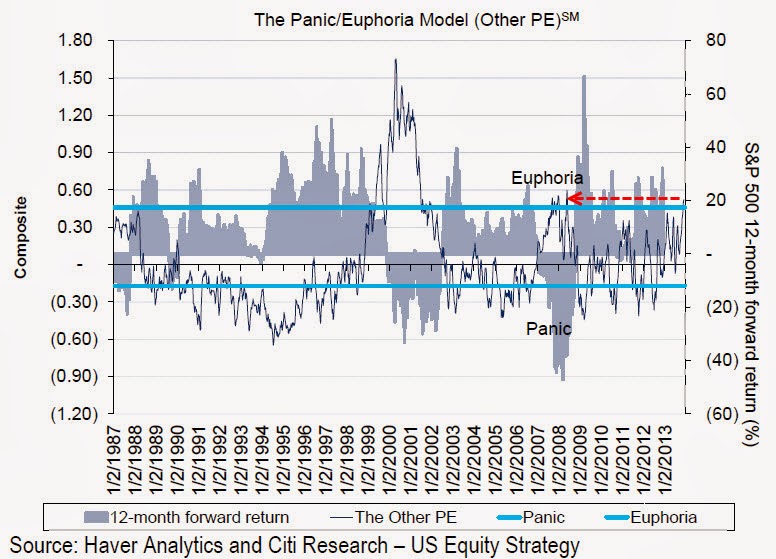
- Other popular sentiment surveys are also flashing sell signals. These include Consensus Inc, Market Vane Bullish Percentage, Hulbert Stock Sentiment Index, Daily Sentiment Index and so forth. Citigroup's own sentiment index is indicating an 80% probability of negative returns in the coming 12 months (chart above). However, during vertical run ups and buying frenzies, prices can continue to rise despite such high optimism. This is usually known as euphoria and it seems we are expericning one right now.
Chart 3: $43 billion has flown into equity funds over the last two months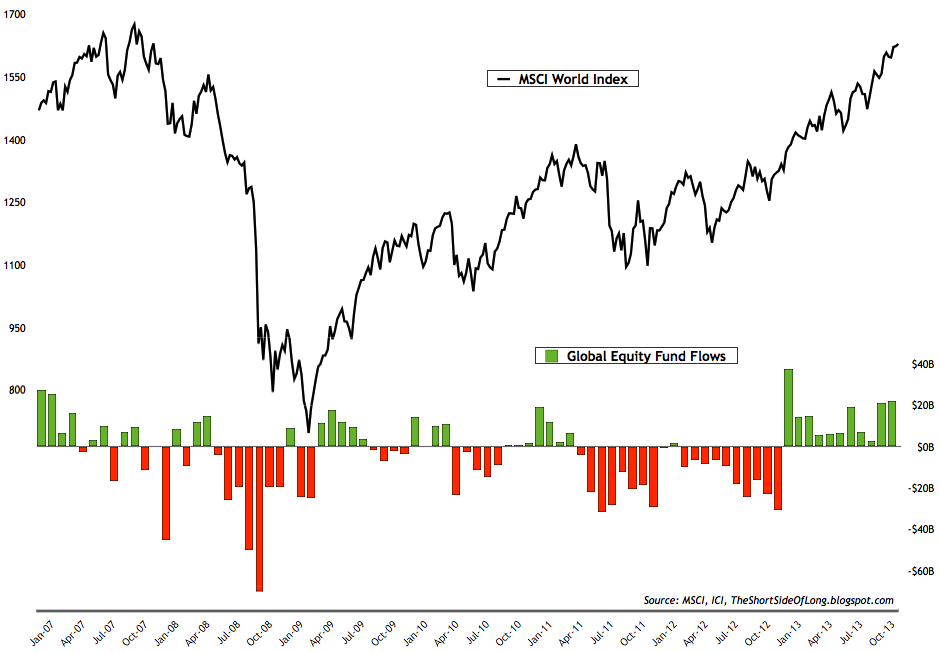
- Recent ICI fund flows reports showed that "equity funds had estimated inflows of $5.43 billion for the week, compared to estimated inflows of $7.26 billion in the previous week. Domestic equity funds had estimated inflows of $1.04 billion, while estimated inflows to world equity funds were $4.39 billion." Looking at the retail investor behaviour of the last two months, the chart above shows that almost $43 billion has flown into equity funds over the last two months. With the bull market entering its 5th year and almost up triple from 09 lows, anyone who tells me we are at the beginning of an uptrend is totally crazy (in my opinion). The fact that retail investors are piling into equities five years too late, lets us know that this most likely isn't a buying opportunity.
- Rydex fund flows has also risen in recent weeks. Nova Ursa flow of funds indicator has jumped towards 0.40, which is usually considered a sell signal. Even more worrying is the continued prolonged period of low cash levels in the Rydex Money Markets, as discussed last month. Now we can also add wild speculation to this, as Rydex Leveraged Long funds now carry almost as much as 9 times the assets of Rydex Leveraged Short funds. For referencing, Nova Ursa Ratio chart can been seen by clicking here.
Chart 4: Hedge funds remain highly exposed towards tech stocks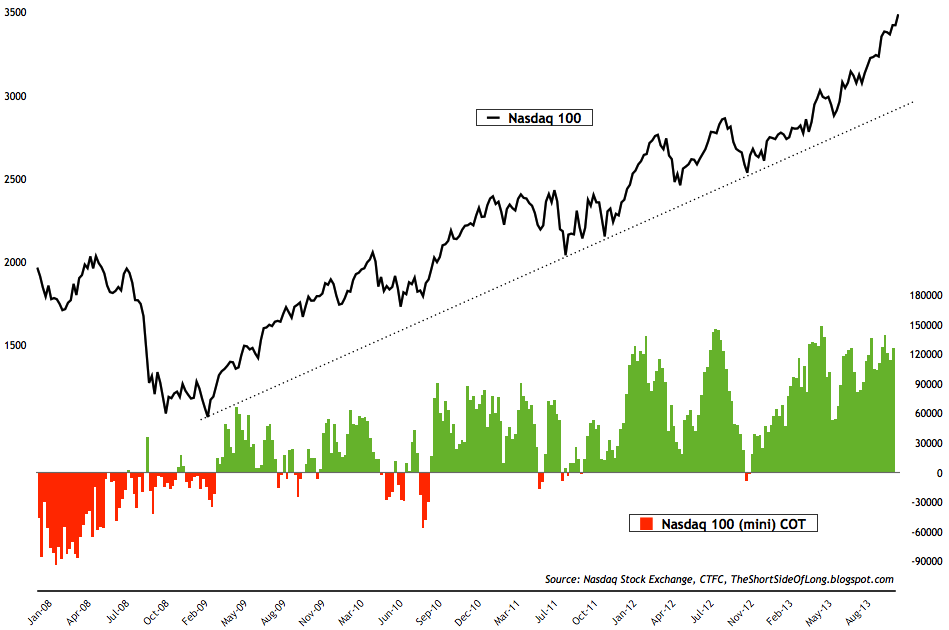
- Recent commitment of traders reports (also known as dumb money) showed that hedge funds and other speculators remain heavily exposed towards technology stocks via the Nasdaq 100 index (as seen in the chart above). Recent positioning is once again above 125,000 net long contracts and has remained above 100,000 for weeks on end. That continues to be one of the most extreme exposures since the March 2009 bull market began.
Chart 5: Corporate insiders continue to remain heavy net sellers
- Recent Corporate Insider reports (also known as smart money) show that net selling remains the name of the game in recent months. While there are no holly grail indicator or tool when it comes to stock market investments, I have always been a huge believer in following corporate insiders as they have access to non-public information about the company in question. Collectively as a group, they hold a much better outlook on the stock market index (as well as a much better track record) then any economists, analyst, forecaster, newsletter writer or trader. The chart above shows how well insiders have navigated the market since the Global Financial Crisis (GFC), always abiding to the old rule of buying low and selling high. Even though the market continues to rise (...for now) as they have been selling, you won't see this group of smart money investors chase prices higher. Now, that's discipline!
Chart 6: Call activity is dominating, but not yet at major extremes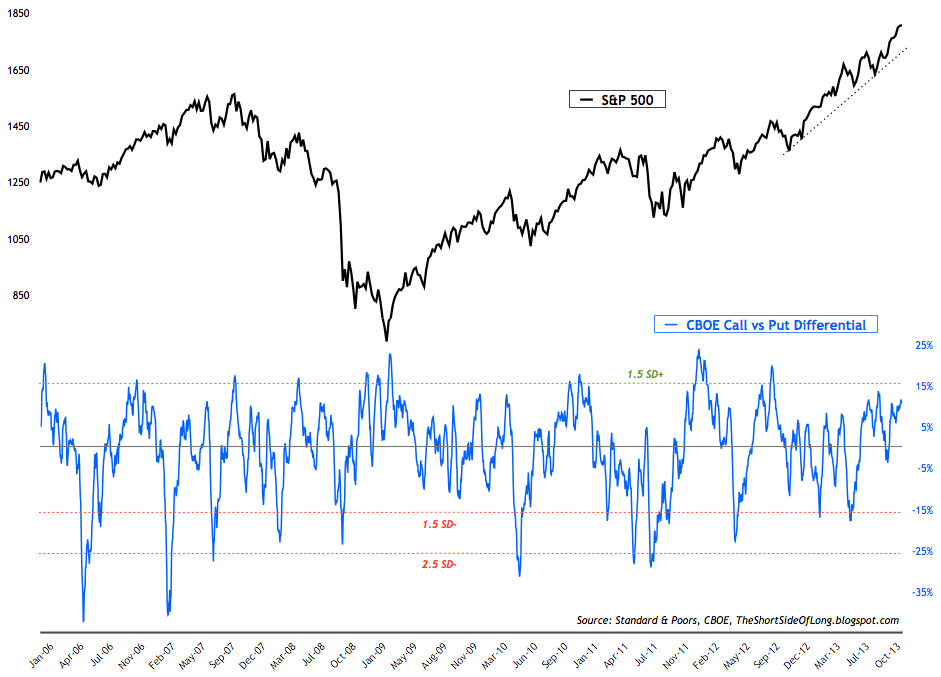
- Recent volatility conditions continue to show same old complacency. The volatility index (VIX) remains at extreme lows (at the time of writing this, the reading is at a very low 14). Simultaneously, the Skew Index continues to remain above 130 on the CBOE exchange. Such high readings, especially when averaged over a 5 or 10 trading days, are a strong selling signal (higher readings indicating a larger probability of a "black swan" market sell off). Finally, the options activity remains quite bullish, but not yet at extremes (as seen in the chart above). Current call vs put ratio buying is about 11% above annual trend, but the market usually tends to put in an intermediate peak as the ratio reaches 16% or higher.
Bonds
- Bond sentiment surveys remain at or close to pessimistic levels, similar to previous months. The slight recovery in Treasury prices during the months of September and October helped elevate extreme pessimism, but not by much. In particular, Consensus Inc survey still remains at one of the more extreme levels in years (other two similar extremes were seen in mid 2009 and early 2011 - both great buying opportunities). For referencing, last months Consensus Inc survey chart can been seen by clicking here.
Chart 7: Bond funds continue to leak capital for a sixth straight month...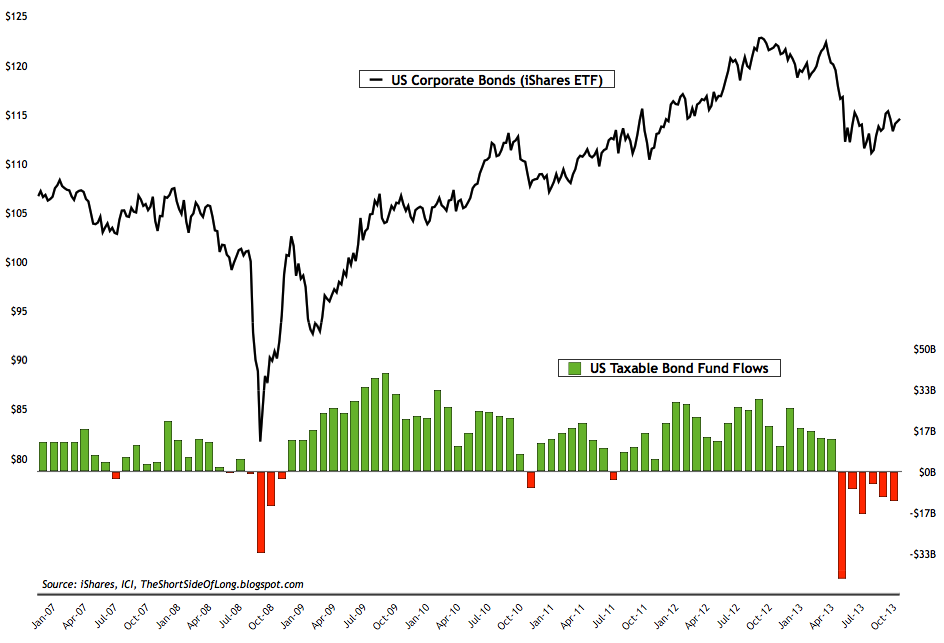
- Recent ICI fund flows reports showed that "bond funds had estimated outflows of $3.24 billion, compared to estimated outflows of $7.57 billion during the previous week. Taxable bond funds saw estimated outflows of $2.14 billion, while municipal bond funds had estimated outflows of $1.09 billion." We are now moving into a sixth consecutive monthly outflow out of all major taxable bond funds. From a contrarian point of view, retail investor selling has almost always given us a good buy signal, at least for a short term trade. From a technical perspective, so far the bond prices have not broken lower as they continue to consolidate.
Chart 8: Speculators push net short bets on Treasuries to extremes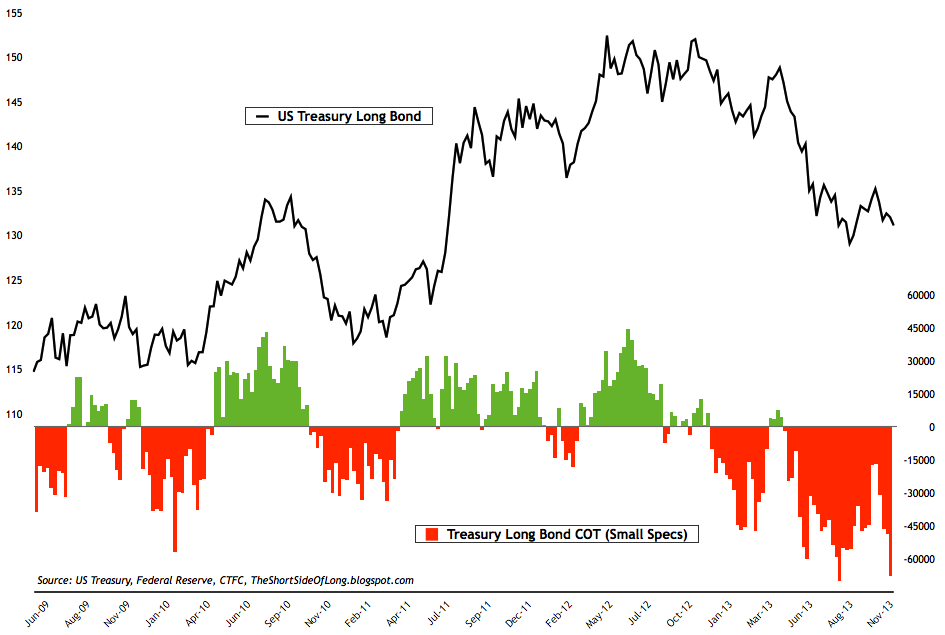
- Recent commitment of traders report (also known as dumb money) shows that small speculators have once again pushed their net short exposure on Treasury bonds towards -68,000 contracts. This is one of the most pessimistic bets on Treasuries in several years and as the chart shows, considerable short positions usually result in a squeeze and an oversold rally. Whether we focus on futures positioning discussed here, or sentiment surveys discussed above, we can conclude that bonds are definitely an un-loved and under-owned asset classes right now.
Chart 9: Stocks vs bonds... the old debate continues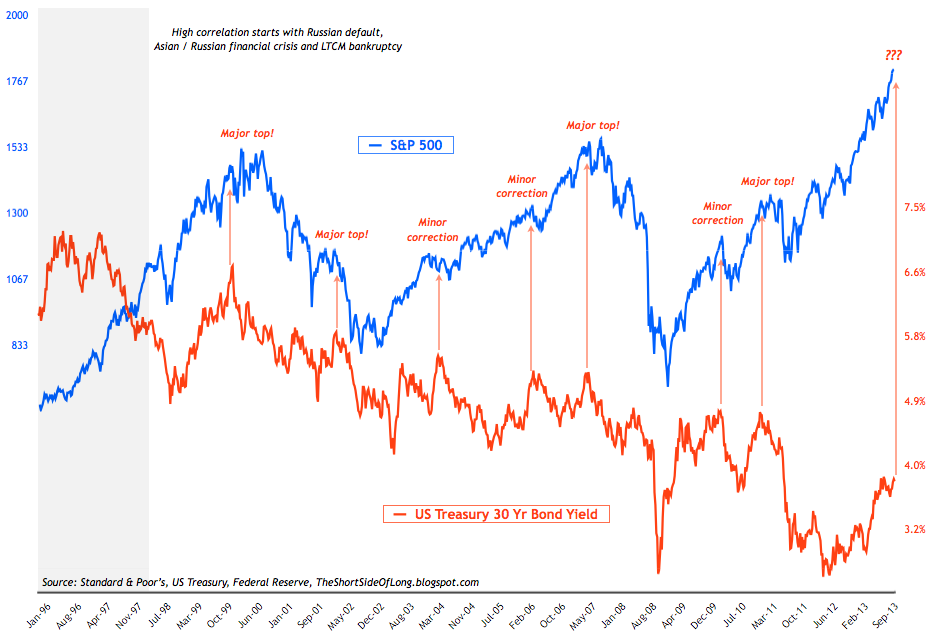
- Side Note: Stocks vs bonds... the old debate continues. When we zoom out by a couple of decades, back towards the late 1990s, we should be able to observe an interesting positive correlation between stock market prices and bond yields. Essentially, despite the fact that both asset classes had their own long term trends, from the medium term perspective bond yields would rise in tandem with the stock market and visa versa. The general view tends to be that rising long term interest rates are a signal of tightening monetary conditions, which tends to slow credit demand and eventually economic activity. The chart above shows that a spike in rates has almost always put the brakes on the stock market rally.
Commodities
Chart 10: Hedge funds remain extremely bearish on commodities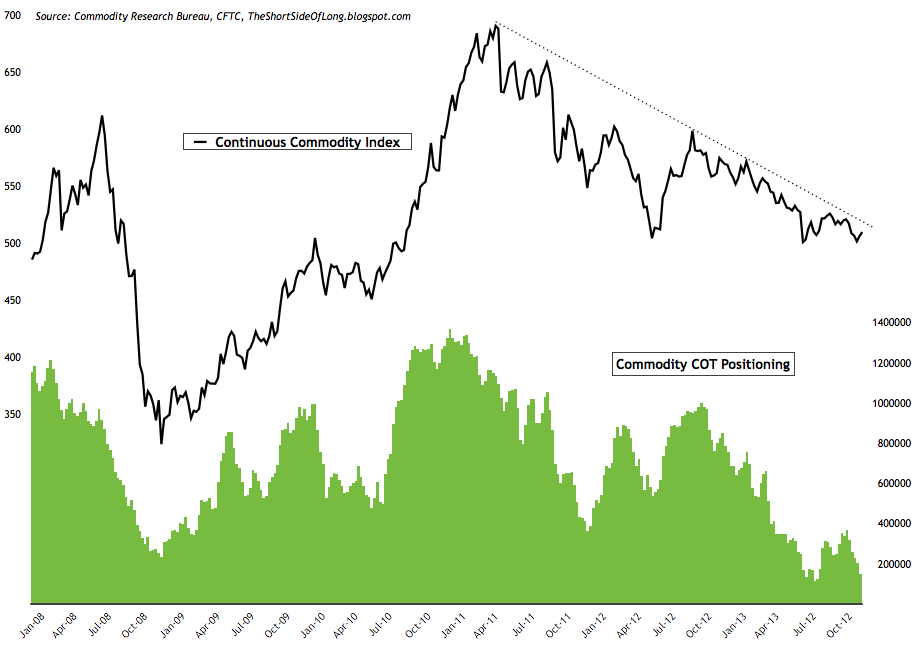
- Recent commitment of traders reports (also known as dumb money) showed that hedge funds and other speculators have been steadily decreasing their commodity exposure, towards previous trough in August. Cumulative net longs currently stand close to 146,000 contracts (custom COT aggregate). Almost all sub sectors saw a decrease in positioning, as hedge funds de-risk out of raw materials. Technically, the overall commodity index still remains in a downtrend, as seen in the chart above.
Chart 11: Industrial metals short positioning resembles the mood of Lehman '08 panic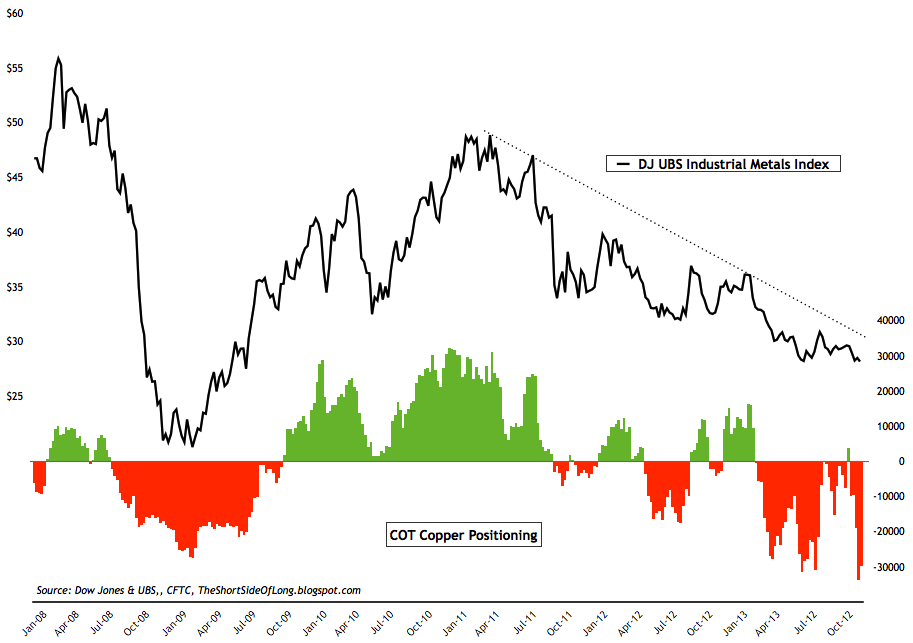
- Dow Jones UBS Industrial Metals Index is currently composed of four futures contracts on industrial metals, three of which (aluminum, nickel and zinc) are traded on the London Metal Exchange (LME) and the other of which (copper) is traded on the Comex. The index remains in a downtrend for almost three years and is down close to 45% from its early 2011 peak. The chart above shows a huge build in net short positioning by hedge funds for one of its components (copper). Previous instances where short build this high occurred was during the depths of the Global Financial Crisis. Industrial metals eventually bottomed and went onto double in value.
Currencies
Chart 12: Hedge funds are building US Dollar net longs again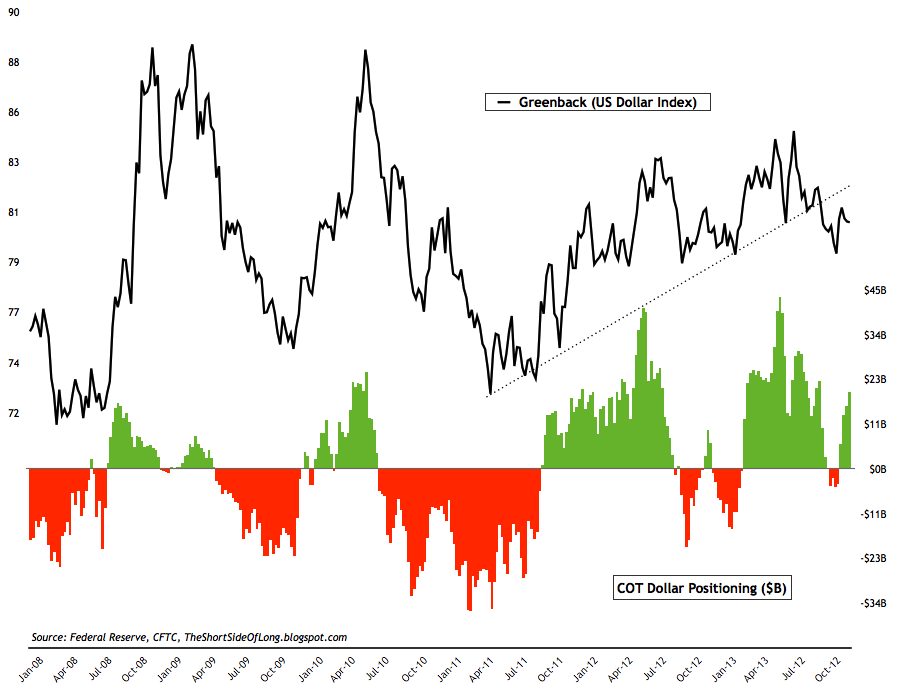
- Recent commitment of traders reports (also known as dumb money) showed a continued increase towards the US Dollar. Cumulative positioning by hedge funds and other speculators has risen in recent weeks towards a modest net long position of $20 billion. Major US Dollar net long positions are evident against the Japanese Yen and the Aussie Dollar. Technically, the greenback has broken down below its uptrend line, which has been in place for the last 2 and half years.
- Currency sentiment survey readings on the US Dollar have moved back towards neutral levels. At the same time, sentiment on the foreign currencies is quite mixed, with investors favouring European currencies like the Euro and the Pound, while disliking Asian currencies like Yen and commodity currencies like the Canadian and Australian Dollars.
Chart 13: Funds have cut their long exposure to the lowest since June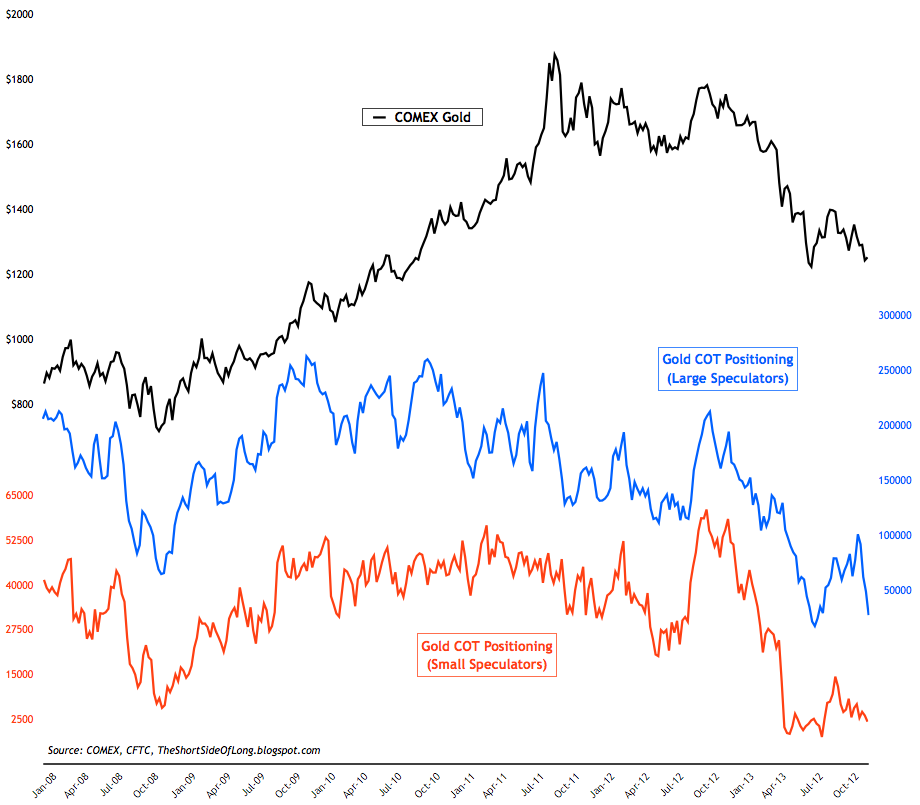
- Recent commitment of traders reports (also known as dumb money) showed hedge funds and other speculators have cut their net long exposure in the precious metals sector to the lowest levels since June of this year. Positioning currently stands at 26,5000 net long contracts on Gold and 6,600 net long contracts on Silver. Dissecting the report further, showed that Gold gross longs are at the lowest level since the Global Financial Crisis of 2008, while gross shorts have once again risen to extreme heights. This type of positioning also confirms the negative sentiment surveys, which I recently covered on the blog last week.
Chart 14: Discount on the popular PMs ETF is at levels not seen since 2001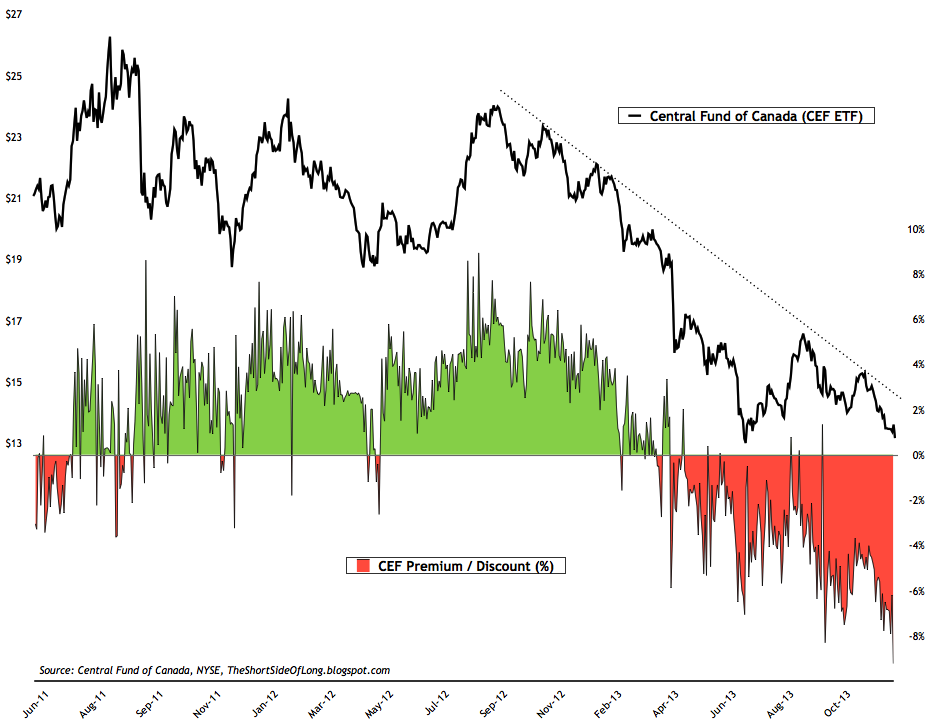
- With the market sentiment for precious metals sector in panic selling, traders have taken the CEF ETF price on the NY stock exchange below its actual true value almost 10% percent over the last 24 hours. In other words, Gold is being sold for $1,220 and Silver for $19.25 on the Comex, however with the discount of almost 10%, these market prices within the fund now stand at $1,100 and $17.35 per ounce. Contrarians should note that the ETF regularly shifts from premium to discount and back again. High premium levels usually, but not always, occur near intermediate peaks while high discount levels usually, but not always, occur near intermediate degree bottoms.
Chart 15: Gold miners are extremely cheap relative to the S&P 500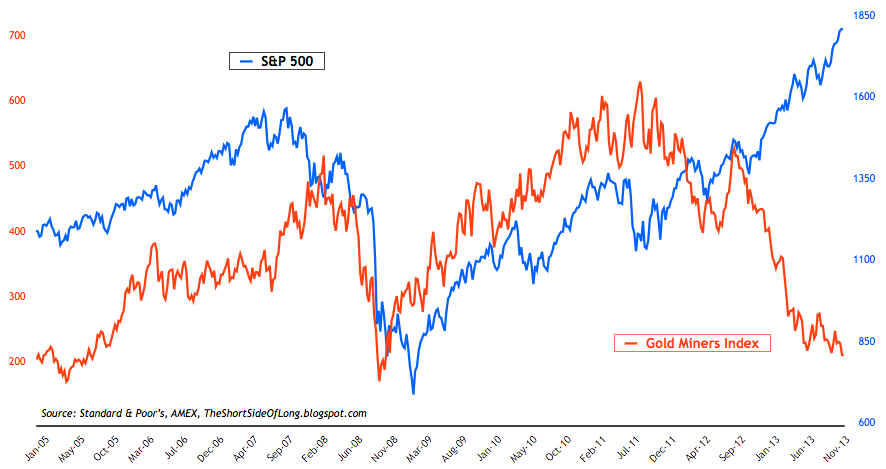
- Side Note: While I covered the stocks vs bonds above, one even more interesting aspect of mis-pricing within the current financial condition is the Gold Miners sector of the stock market. Sectors such as Consumer Discretionary, Biotech, Health Care and Industrials have become overvalued throughout 2013 (with S&P 500 CAPE10 now nearing 25), one of the cheapest sectors of the market, both nominally and relatively, is the Gold Miners Index. The chart above shows a huge divergence between the two since late 2012.