Before I start the December Market Breadth summary, let me do a quick update on a few interesting developments. Firstly, we are now entering the holiday season, therefore over the next couple of days I will post the last of the updates for 2014. After that I will be taking some time off. Therefore, let me take this opportunity to wish all of you a very Merry Christmas, happy New Year and the safe holiday season.
The month of December has produced quite a lot of volatility and short-term oversold breadth conditions. Let us look at these developments in-depth and try to better understand why the market has rebounded so swiftly over the last week.
Chart 1: October and December have been very volatile months for stocks
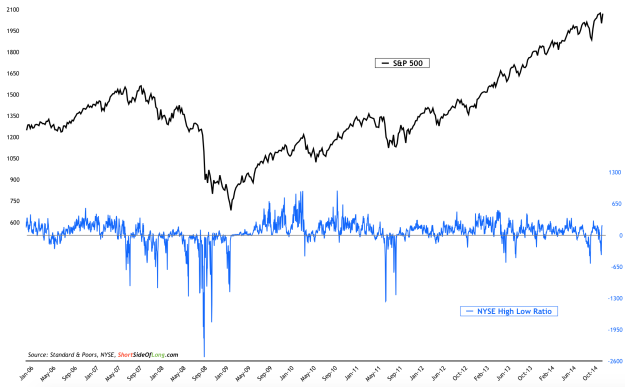
Recently, the VIX rose above 25 for several days in the row and S&P 500 dropped almost 5% in only a matter of days. US Small Caps, as well as other global equity indices, fell even more. In similar fashion to the October correction that we just recently went through, the percentage of news lows vs new highs indicated a short term oversold condition.
Only several days ago this ratio got down to as low as -410, indicating 410 more NYSE components making new lows relative to new highs. If we compare this to October’s oversold conditions, we saw the ratio of new highs to new lows fall as low as -588 (refer to Chart 1). To a certain degree, the current market corrections resemble that of summer 2013, during the “taper tantrum”. Volatility increased, breadth became oversold and prices of major indices corrected. However, the bull run continued and it seems that the tape is once again signalling that the path of least resistance might be up.
Chart 2: During recent price dip, advance decline line became oversold
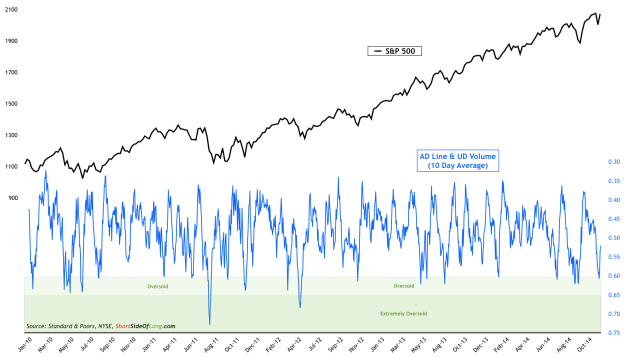
The advance decline line, averaged over the last 10 days (short term), fell below 0.60 during the recent correction. Interestingly, as the index dropped about 5% and breadth became oversold, bulls very quickly picked up stocks. As a result of strong buying pressure, prices now find themselves near or at record highs. We have seen this type of a condition occur before, in particular during the recent rally that started in November 2012, where bulls continue to “buy the dips”. The most important question is, how long can this type of investment mentality remain in place for, before the stock market experiences a much large correction? Let us remember that nothing lasts forever.
Chart 3: Under QE, bearish breadth divergences have not mattered much
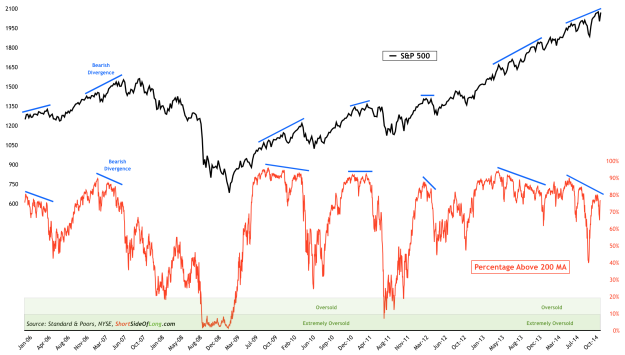
Since we continue to remain in an artificial recovery, mainly supported by extreme monetary measures by global central banks, not many indicators have done a good job predicting downside surprises, as they normally would. For example, let us consider the constant, almost never ending, bearish divergence between the new stock market highs and a gradual drop in the percentage of stocks trading above the 200 day moving average. Previous divergences like we find ourselves in today, have almost always led to downside surprises (eventually). However, under the QE regime stock markets continue to propel higher.
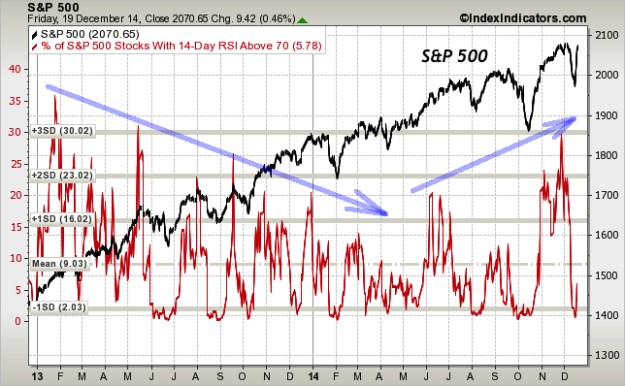
However, not all indicators are sending bearish signals either. Let us observe Chart 4 very carefully. Here we are tracking the percentage of stocks that are trading in technically overbought zones (a very common indicator where the daily RSI goes above 70). During the whole of 2013, we saw breadth diminishing, so that fewer and fewer stocks within the S&P index traded upward into their respective overbought zones. However, starting in May 2014, we saw this condition change in the form of an expending number of S&P components in the overbought zone. In other words, more stocks are surging higher, commonly known as a bull market.
Chart 4: This year there is an improvement in some breadth indicators
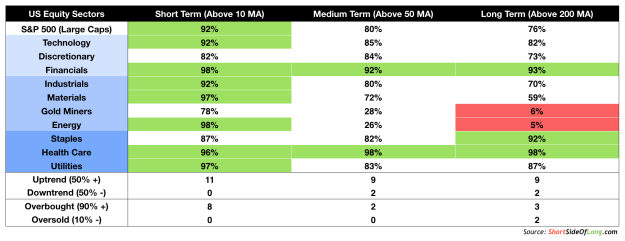
Finally, we look at the sector breadth readings. While the US market itself trades at or near record highs, major sectors have had quite diverse performances. Let us consider commodity sectors such as Energy, Materials and Gold Miners. These assets have been sold down hard in recent corrections (both October and December), as underlying commodity prices such as Crude Oil and Gold remain under pressure. Both the Energy and Gold Mining sectors have single digit percentages of components trading above their respective 200 day moving averages. This basically means both are extremely oversold right now.
On the other hand, sectors such as Technology, Financials and Heath Care sectors have done very well. Furthermore, prices continue to act strong, with all three making new bull market highs. Having said that, all three are also incredibly overbought… especially Financials and Health Care. Both of these sectors currently have 92% or more of comments above 10 day, 50 day and 200 day moving averages (short, medium and long term breadth readings). This is quite a rare occurrence, so we shouldn’t be surprised to see some of these sectors take a pause or even correct after a recent surge.
Chart 5: Financials and Health Care sectors are very much overbought
