423,000 in November. 257,000 in January. 223,000 in April. 280,000 in May. Economists are acting like the new normal in monthly jobs growth is 200,000-plus. They’re celebrating a 5.5% unemployment rate. It’s as if no one else is looking at demographics! But even then, today’s figures don’t tell the whole story.
The labor force is 157.5 million people as of May. If you include the labor force participation rate, the unemployment rates moves from 5.5% to around 9.2%! The participation rate fell between January 2007 and March 2015, from 66.4% to a low of 62.7%. That’s a loss of 5.85 million people! How convenient to exclude that staggering number from the unemployment rate!
Then if you add the people who are working part-time but want full-time work, unemployment gets close to 11%! But the numbers simply don’t tell the whole story.
There’s really only one reason we’ve been experiencing the kind of job growth we’ve seen since the financial crisis, especially over the past two to three years. We’re making up for what we lost in the financial crisis.
In 2008 and 2009 alone we lost close to 8.7 million jobs. Of course we’ve been adding around 200,000 jobs every frickin’ month for the past couple years! An economy is supposed to recover coming out of a recession.
Another way of putting it is this: We haven’t really gained anything. We’re just making up for lost time!
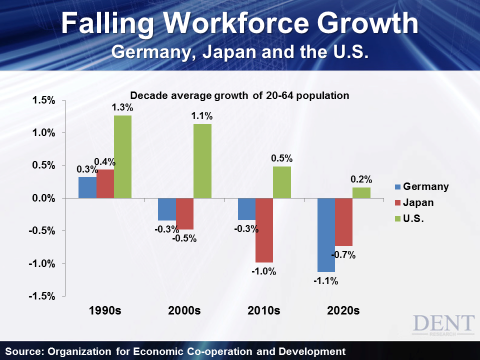
But this won’t go on for much longer. With our demographic outlook, the picture looks much worse ahead. Once we catch up on these laid off workers and get to full employment, our labor force will grow at a rate of only 0.5% for the rest of this decade. Next decade it’s even worse, at 0.2%.
At 0.5%, we grow at a rate of about 66,000 a month — nowhere near 200,000.
Let’s compare the U.S. to Germany and Japan to get an idea of where this is going.

Japan aged first as its baby-boom births peaked between 1942 and 1949. This isn’t on the chart, but in the 1960s, its peak labor force growth was 2.2%. As you can see, it fell to 0.4% in the 1990s, and -0.5% in the 2000s. This decade, it drops to -1.0%, and will continue in the red next decade at -0.7%.
Germany looks no better. That country peaked at 1.1% in the ‘80s and fell to -0.3% both this decade and last. In the 2020s they’ll see a crushing rate of -1.1%.
The U.S. has fared better due to high immigration in the past, but even that’s been fading since the recession and will be even lower in this slow-growth economy.
Where does that leave us going forward? With fewer jobs, businesses won’t expand into new office buildings or factories. With fewer jobs, less and less people will buy houses. Even with jobs growth aside, demographics will continue to eat away at real estate as I showed in Chapter 3 of The Demographic Cliff. There will be more boomers dying than new adults coming of age to buy homes.
That will cause net demand for homes to fall until 2039. Economists are simply projecting trends in a straight-line pointing up. How stupid and naïve! A simple demographic calculation shows that economic and job growth ahead will be nothing like projected.
Even when the next global boom begins in the early 2020s, the growth rates for GDP, labor force and real estate will be much lower than the boom we saw between 1983 and 2007.
