
EUR/USD - European Session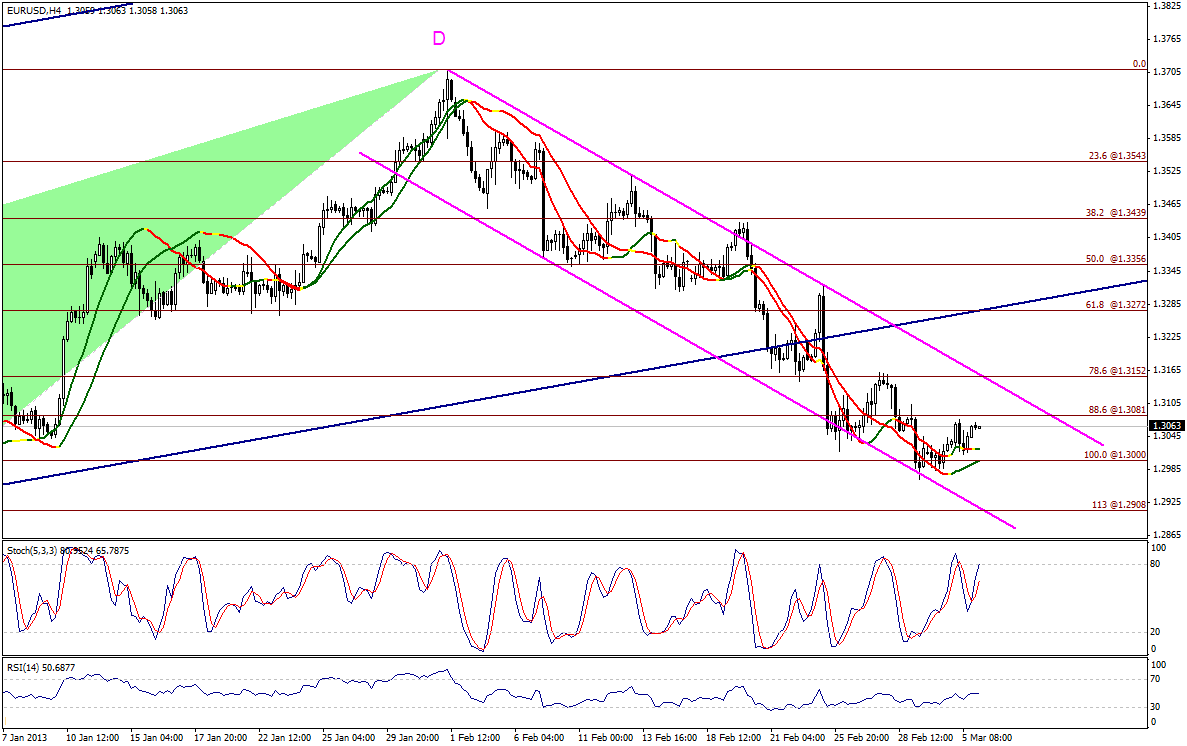 EUR/USD" title="EUR/USD" width="1187" height="746">
The pair rose slightly, but is still stable below 1.3080 levels, as stability below it forces us to hold on to our negative expectations affected by the AB=CD bearish harmonic Pattern referred to earlier. A descending channel organized the pair’s movement from top D shown on graph, and negativity is valid with stabilizing below 1.3155 levels. As for today, we count on stability below 1.3080 levels to keep the bearish outlook.
The trading range for today is among the key support at 1.2905 and key resistance at 1.3155.
The general trend over short term basis is to the upside targeting 1.4375 as far as areas of 1.2990 remains intact.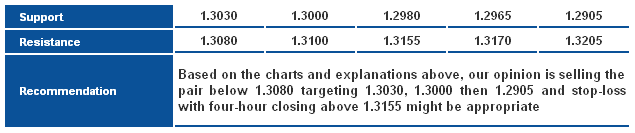 EUR/USD_S&R" title="EUR/USD_S&R" width="635" height="133">
GBP/USD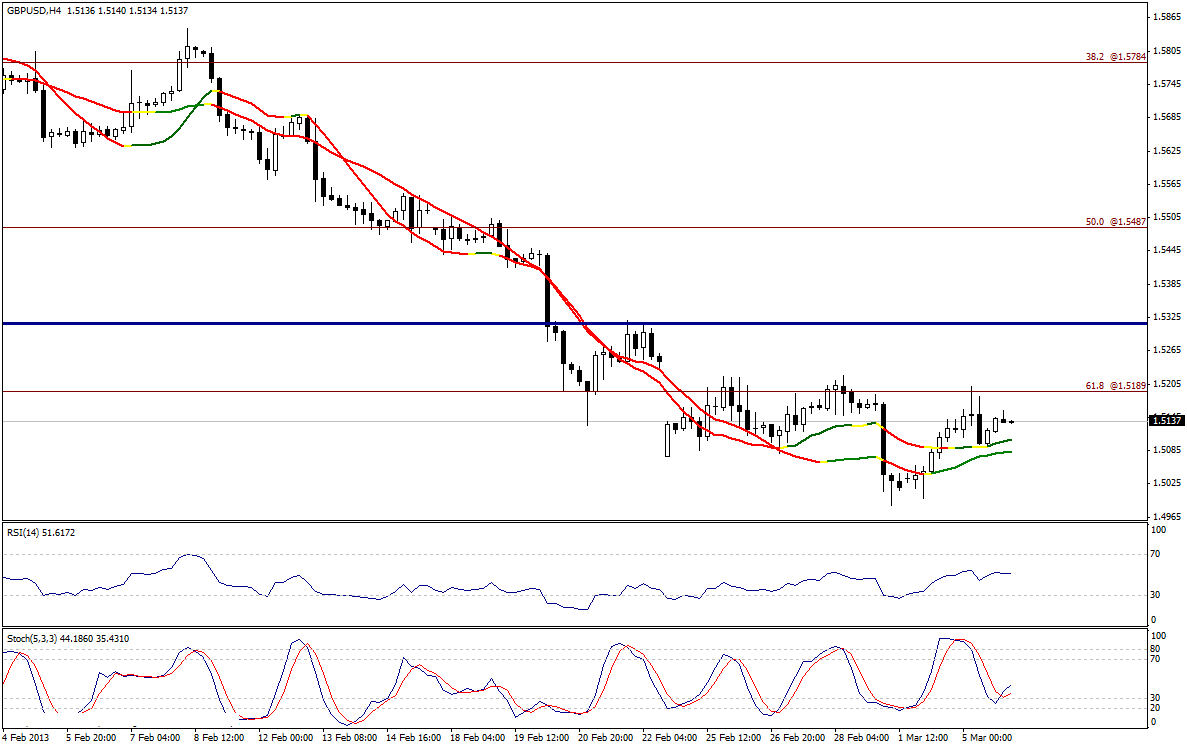 GBP/USD" title="GBP/USD" width="1187" height="746">
Areas of 1.5190 halted all upside attempts. On a four-hour basis, we have some positive catalysts represented in a positive crossover on Stochastic and a bullish bias on Linear Regression Indicators. Our intraday expectations depend on 1.5190 levels, stability below it forces us to expect a downside move; while a breakout above will trigger an intraday upside correction affecting today’s session.
The trading range for today is among key support at 1.4965 and key resistance at 1.5310.
The general trend over short term basis is to the downside targeting 1.6875 as far as areas of 1.4225 remains intact.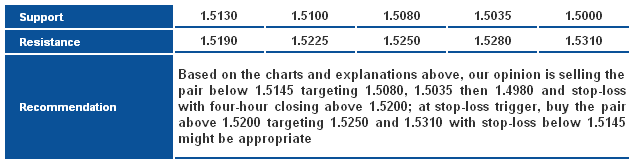 GBP/USD_S&R" title="GBP/USD_S&R" width="634" height="163">
USD/JPY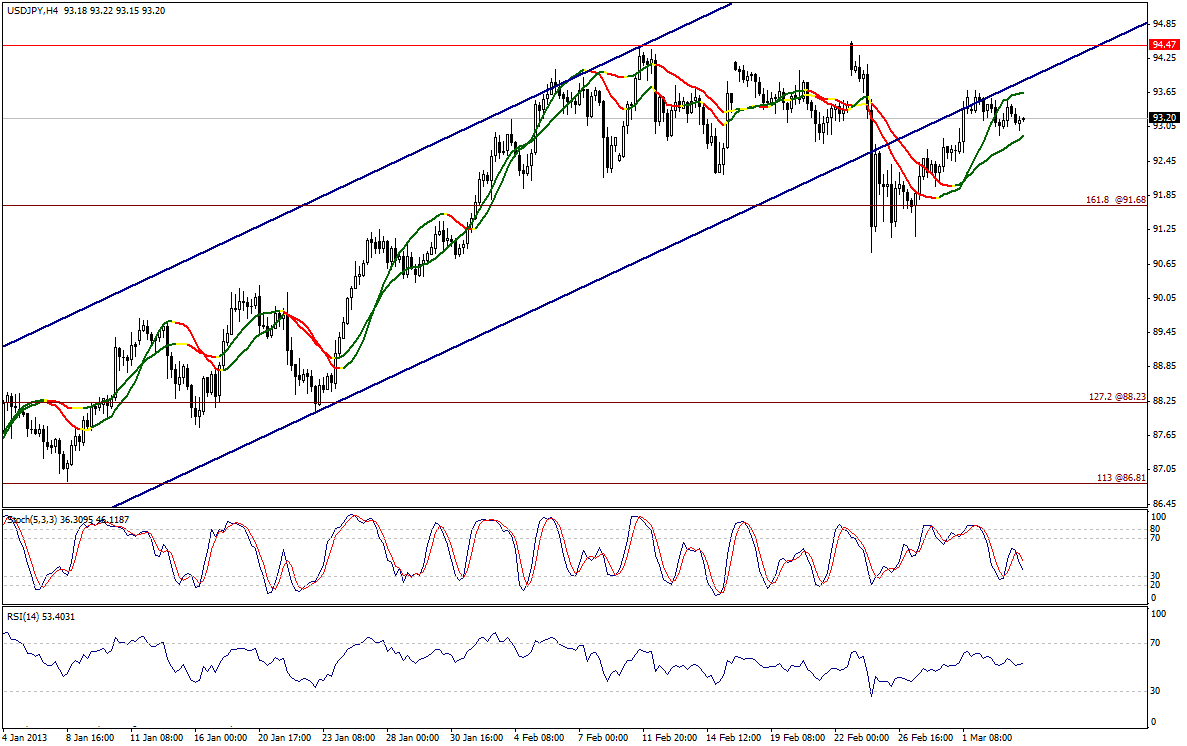 USD/JPY" title="USD/JPY" width="1187" height="746">
The pair is trading in a narrow range below the broken ascending channel key support. We think that the bearish move is valid today with stability below 93.85. A breakout below Linear Regression Indicator 55 residing at 92.80 will support negativity.
The trading range for today is among key support at 91.65 and key resistance at 94.25.
The general trend over short term basis is to the upside targeting 100.00 as far as areas of 84.00 remain intact.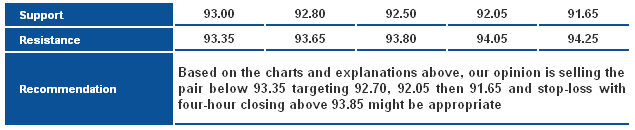 USD/JPY_S&R" title="USD/JPY_S&R" width="635" height="130">
USD/CHF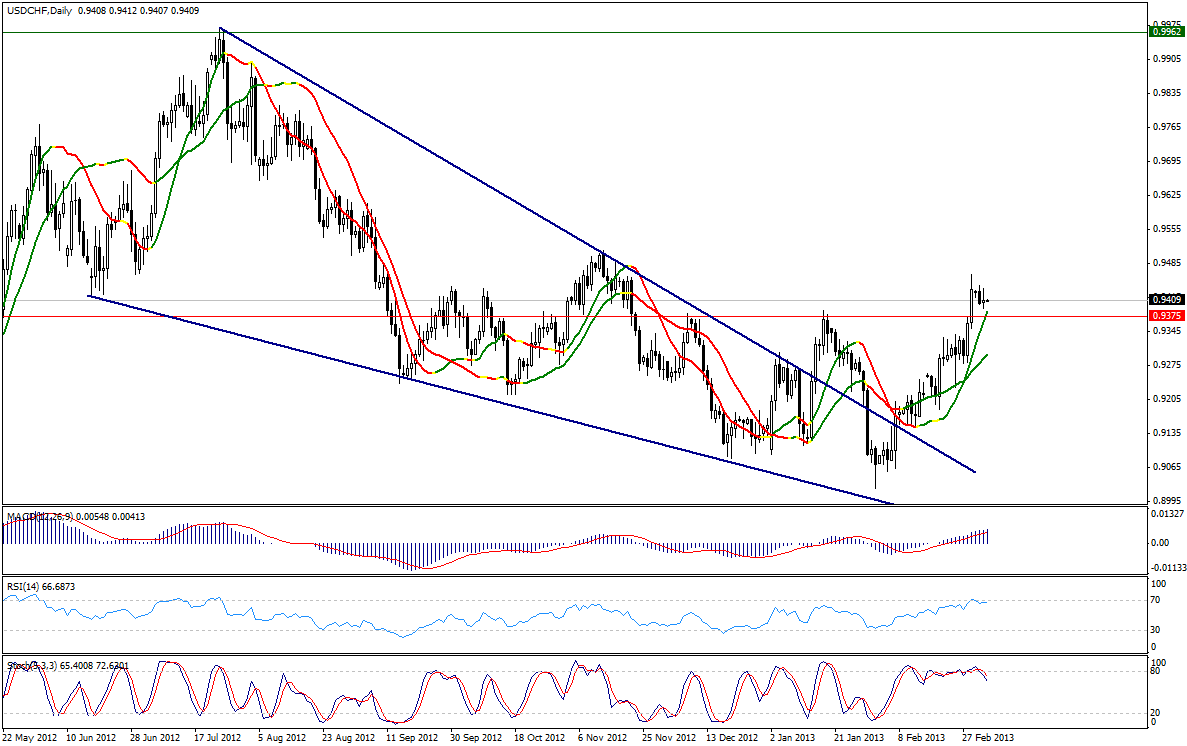 USD/CHF" title="USD/CHF" width="1187" height="746">
The pair is seemingly on break! Trading is within a narrow range after sharp upside move during the past period. The slight downside bias is limited above 0.9375, and accordingly we still see the bullish move valid especially with stability above 38.2% correction shown on graph at 0.9385 levels.
The trading range for today is among key support at 0.9320 and key resistance at 0.9570.
The general trend over short term basis is to the downside stable at levels 0.9775 targeting 0.8860.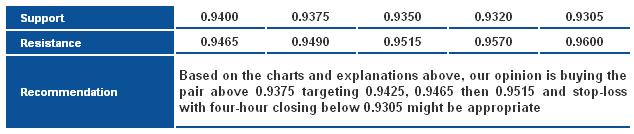 USD/CHF_S&R" title="USD/CHF_S&R" width="634" height="134">
USD/CAD USD/CAD" title="USD/CAD" width="911" height="662">
The pair offers clear negative bias which is normal after forming the bearish harmonic Bat Pattern, which we expect will extend the bearish correction. Trading below 1.0355 levels will keep the pattern valid, as momentum indicators reflect negativity.
The trading range for today is between the key support at 1.0120 and the key resistance at 1.0355.
The general trend over short term basis is to the upside with steady daily closing above levels 0.9800 targeting 1.0485.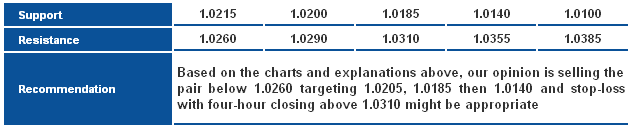 USD/CAD_S&R" title="USD/CAD_S&R" width="632" height="128">
AUD/USD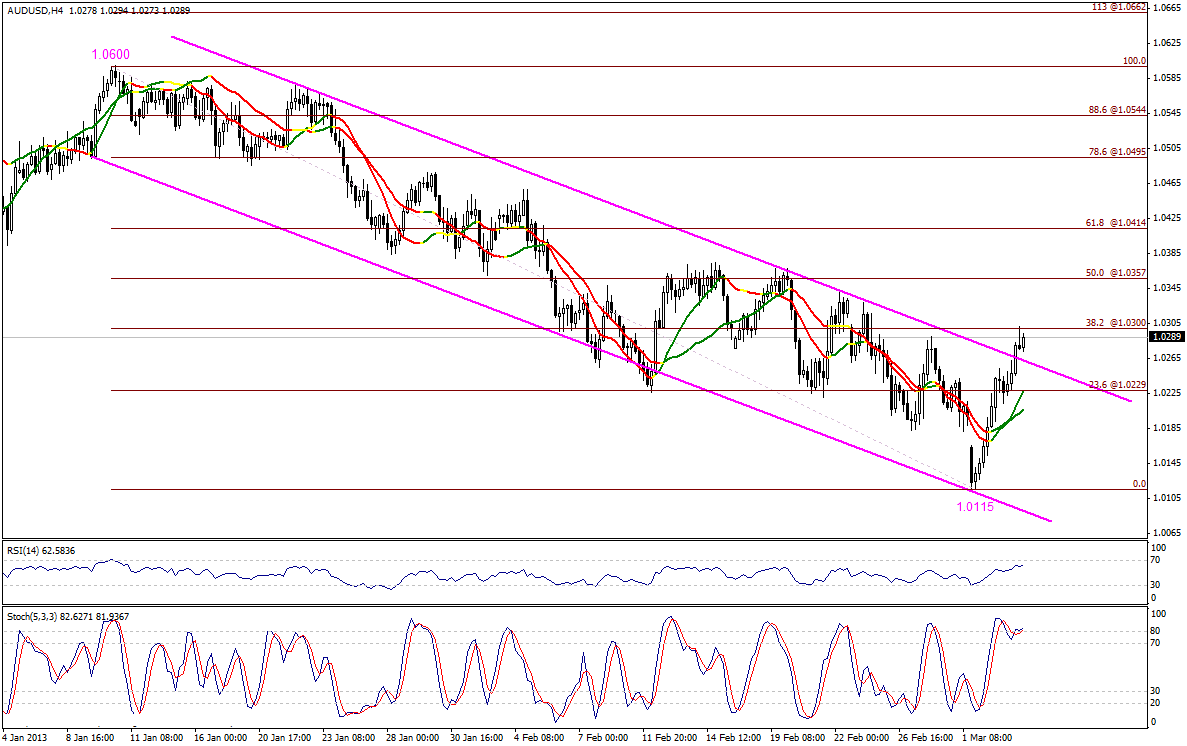 AUD/USD" title="AUD/USD" width="1187" height="746">
The pair breached key resistance of the descending channel that organized trading from the top around 1.0600 levels, that might extend the upside move. Volatility is expected and perhaps a slight movement to the downside, but trading above 1.0225 levels is positive now.
The trading range for today is among key support at 1.0185 and key resistance at 1.0415.
The general trend over short term basis is to the downside with steady daily closing below levels 1.0710 targeting 0.9400.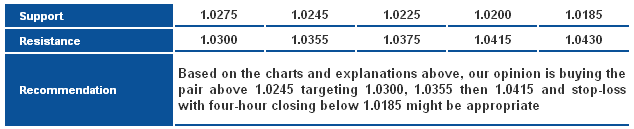 AUD/USD_S&R" title="AUD/USD_S&R" width="634" height="129">
NZD/USD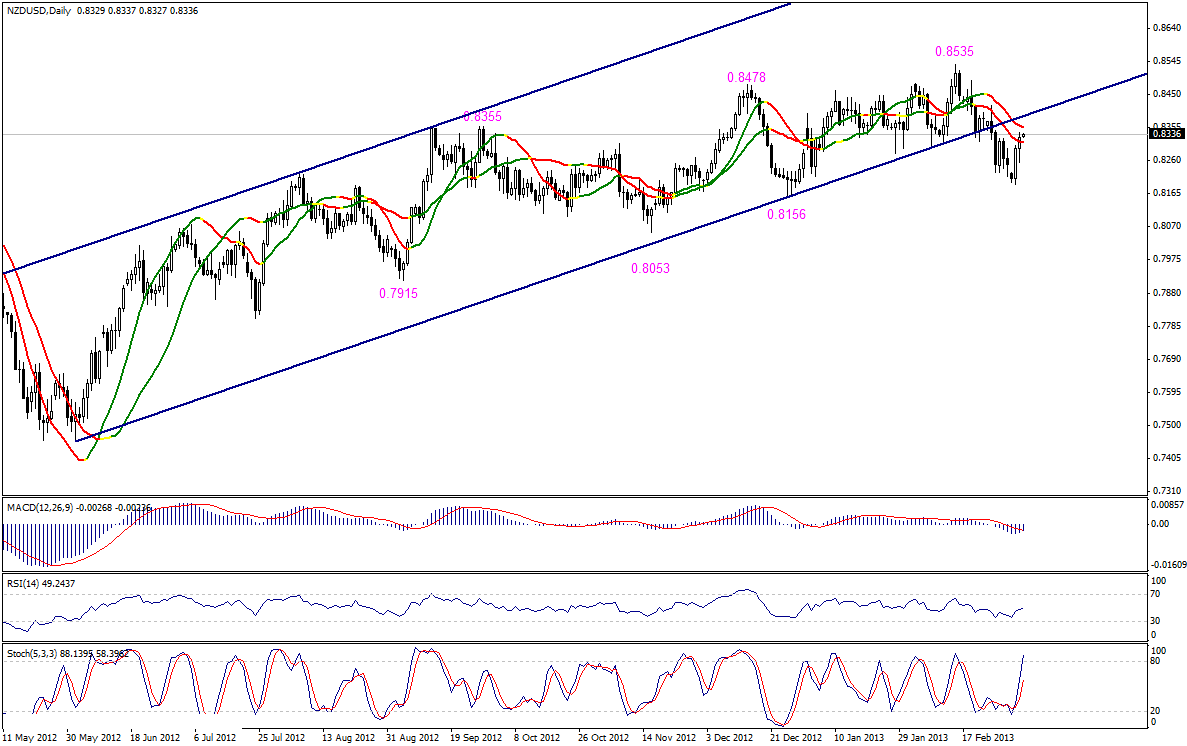 NZD/USD" title="NZD/USD" width="1187" height="746">
The pair is moving gradually to the upside and trading now above Linear Regression Indicator 34. With that, the pair is still trading below key support level of the medium-term ascending channel and that prevents us from favoring bullishness. For the downside move to return, the pair must stabilize again below 0.8275 levels. Therefore, we prefer to remain neutral today waiting for confirmation signals.
The trading range for today might be among key support at 0.8225 and key resistance at 0.8400.
The general short-term trend is expected to the upside with daily closing above 0.8130 targeting 0.8845.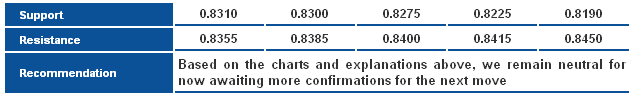 NZD/USD_S&R" title="NZD/USD_S&R" width="875" height="120">
GBP/JPY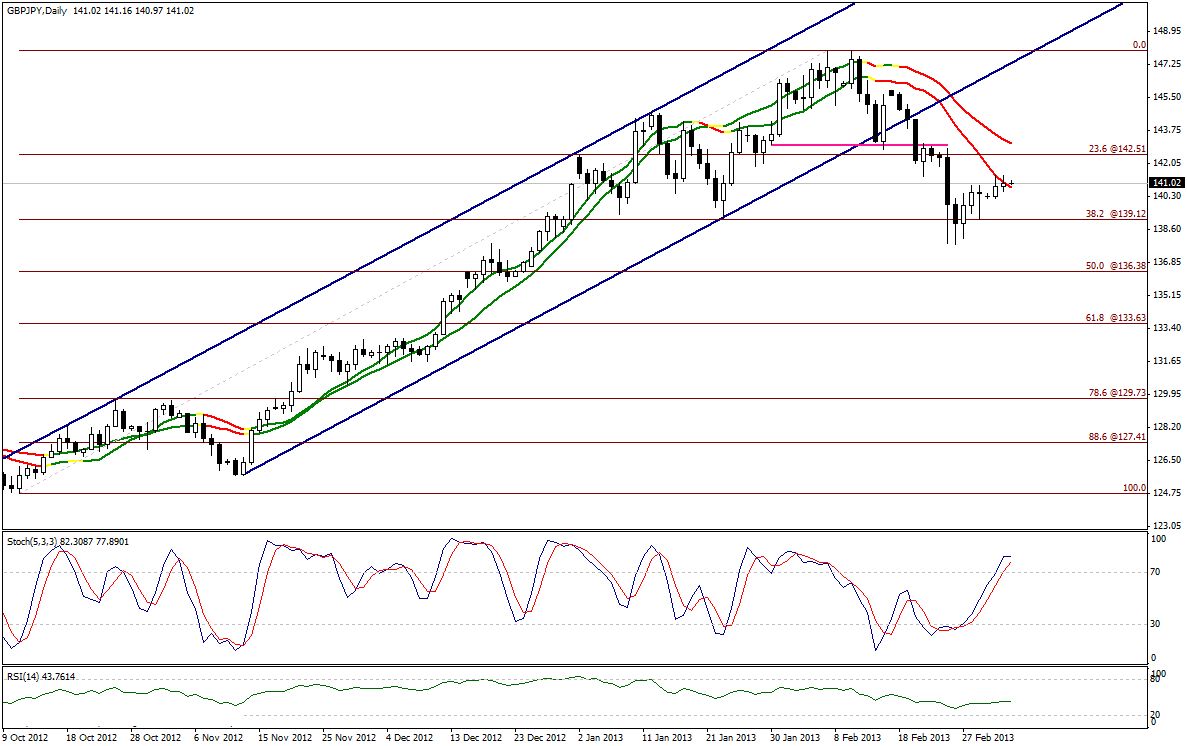 GBP/JPY" title="GBP/JPY" width="1187" height="746">
The GBP/JPY still attempts to reside above Linear Regression Indicators 34. Trading takes a stable path below 141.80, most importantly below key level 142.50. We are compelled to retain our negative outlook, considering overbought signals reflected by Stochastic.
– The trading range expected today is between the key support at 137.90 and the key resistance at 143.15
– The short-term trend is downside targeting 133.60 if 147.80 remains intact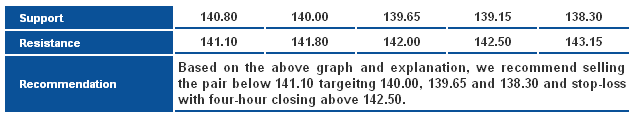 GBP/JPY_S&R" title="GBP/JPY_S&R" width="636" height="117">
EUR/JPY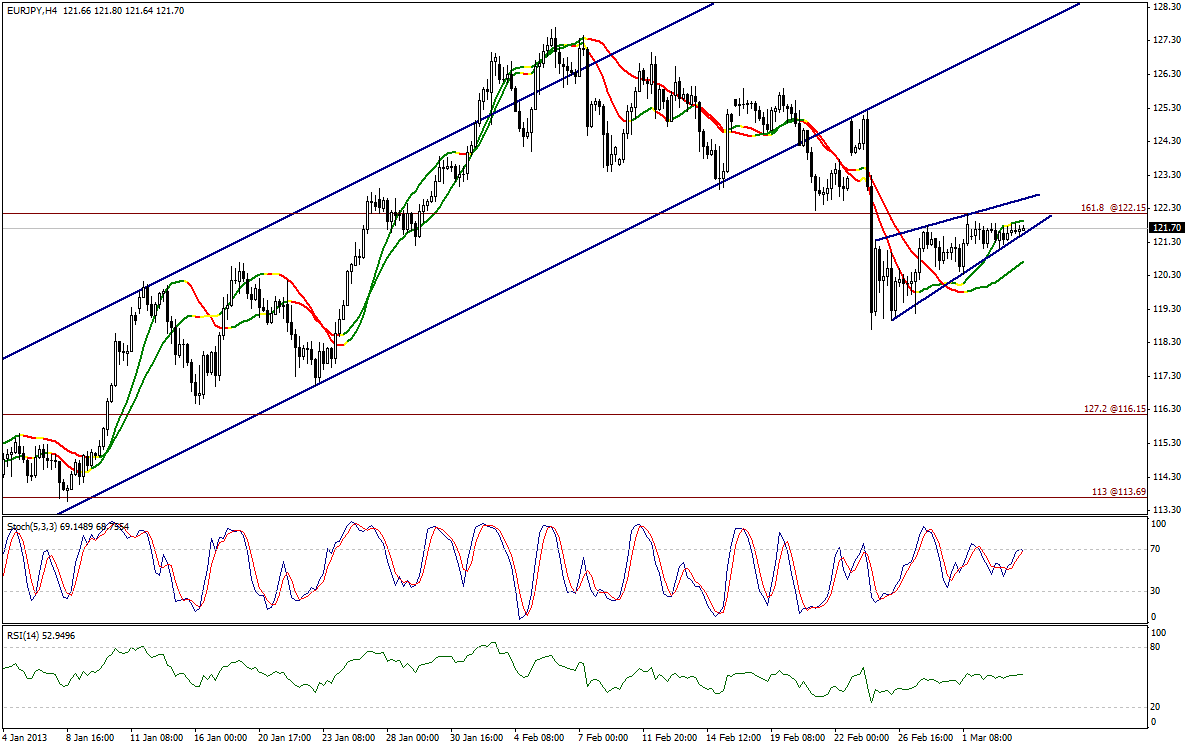 EUR/JPY" title="EUR/JPY" width="1187" height="746">
EUR/JPY is forming the Rising Wedge Pattern (continuation) – a negative technical setup – as current trading below 122.15 maintains chances of the occurrence of a downtrend. However, in order for this technical formation to be activated, the pair must break the pattern's key support existing at 121.50. Stochastic attempts a negative crossover at the 70-points line, boosting negativity.
– The trading range expected today is between the key support at 119.25 and the key resistance at 122.15
– The short-term trend is upside targeting 128.75 if 109.45 remains intact at week's closing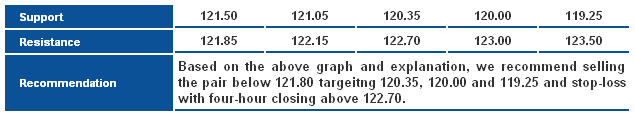 EUR/JPY_S&R" title="EUR/JPY_S&R" width="635" height="116">
EUR/GBP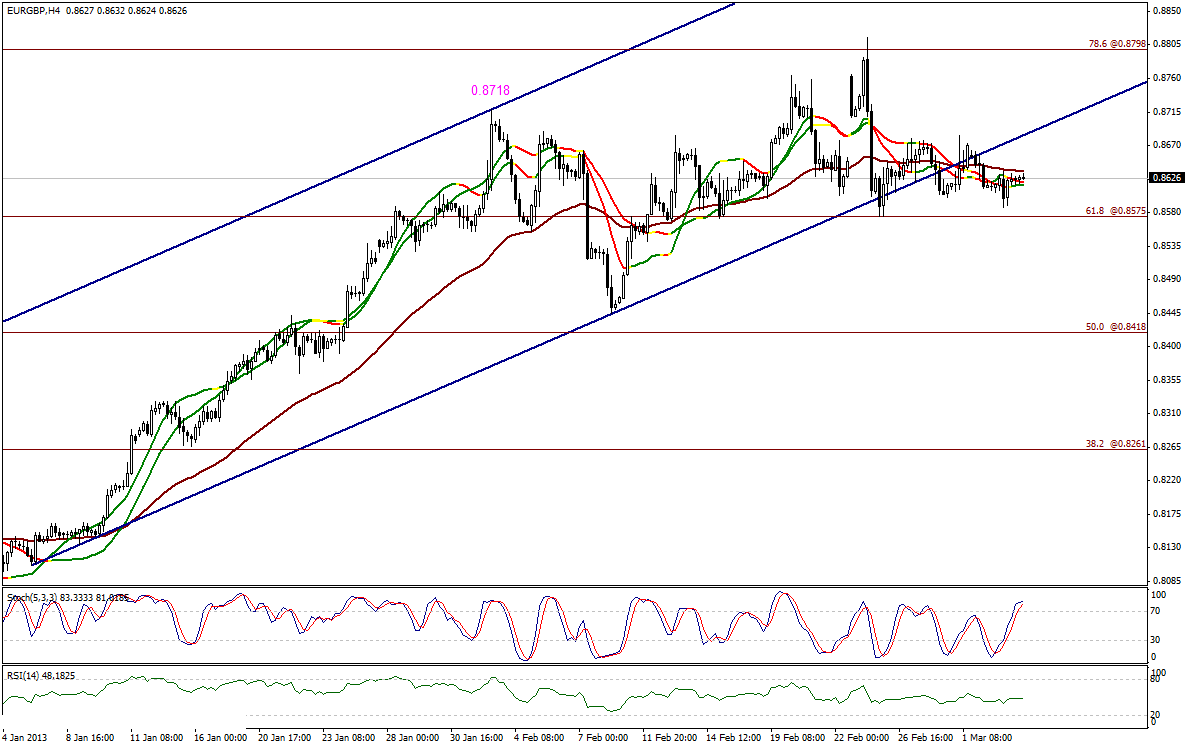 EUR/GBP" title="EUR/GBP" width="1187" height="746">
EUR/GBP is trading within an extremely narrow range in the vicinity of Linear Regression Indicators 34 and 55, as well as below the Exponential Moving Average (EMA) 50. By and large, the pair is holding above the the lower line, or support, at 0.8575 however, below the ascending channel's support – now resistance. Present technical circumstances compel us to stand aside today, that is until better signs emerge.
– The trading range expected today is between the key support at 0.8500 and the key resistance at 0.8740
– The short-term trend is upside targeting 1.0370 if 0.7785 remains intact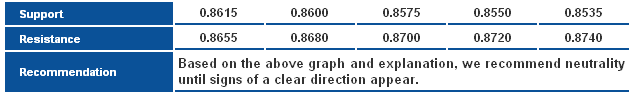 EUR/GBP_S&R" title="EUR/GBP_S&R" width="635" height="97">
- English (UK)
- English (India)
- English (Canada)
- English (Australia)
- English (South Africa)
- English (Philippines)
- English (Nigeria)
- Deutsch
- Español (España)
- Español (México)
- Français
- Italiano
- Nederlands
- Português (Portugal)
- Polski
- Português (Brasil)
- Русский
- Türkçe
- العربية
- Ελληνικά
- Svenska
- Suomi
- עברית
- 日本語
- 한국어
- 简体中文
- 繁體中文
- Bahasa Indonesia
- Bahasa Melayu
- ไทย
- Tiếng Việt
- हिंदी
Daily Technical Report: Major And Cross Currencies: March 06, 2013
Published 03/06/2013, 04:34 AM
Updated 07/09/2023, 06:31 AM
Daily Technical Report: Major And Cross Currencies: March 06, 2013
Latest comments
Loading next article…
Install Our App
Risk Disclosure: Trading in financial instruments and/or cryptocurrencies involves high risks including the risk of losing some, or all, of your investment amount, and may not be suitable for all investors. Prices of cryptocurrencies are extremely volatile and may be affected by external factors such as financial, regulatory or political events. Trading on margin increases the financial risks.
Before deciding to trade in financial instrument or cryptocurrencies you should be fully informed of the risks and costs associated with trading the financial markets, carefully consider your investment objectives, level of experience, and risk appetite, and seek professional advice where needed.
Fusion Media would like to remind you that the data contained in this website is not necessarily real-time nor accurate. The data and prices on the website are not necessarily provided by any market or exchange, but may be provided by market makers, and so prices may not be accurate and may differ from the actual price at any given market, meaning prices are indicative and not appropriate for trading purposes. Fusion Media and any provider of the data contained in this website will not accept liability for any loss or damage as a result of your trading, or your reliance on the information contained within this website.
It is prohibited to use, store, reproduce, display, modify, transmit or distribute the data contained in this website without the explicit prior written permission of Fusion Media and/or the data provider. All intellectual property rights are reserved by the providers and/or the exchange providing the data contained in this website.
Fusion Media may be compensated by the advertisers that appear on the website, based on your interaction with the advertisements or advertisers.
© 2007-2024 - Fusion Media Limited. All Rights Reserved.