Get 40% Off
🚨 Volatile Markets? Find Hidden Gems for Serious Outperformance
Find Stocks Now

Daily Technical Report: January 27, 2015

Published 01/27/2015, 05:07 AM
Updated 07/09/2023, 06:31 AM

EUR/USD - European Session
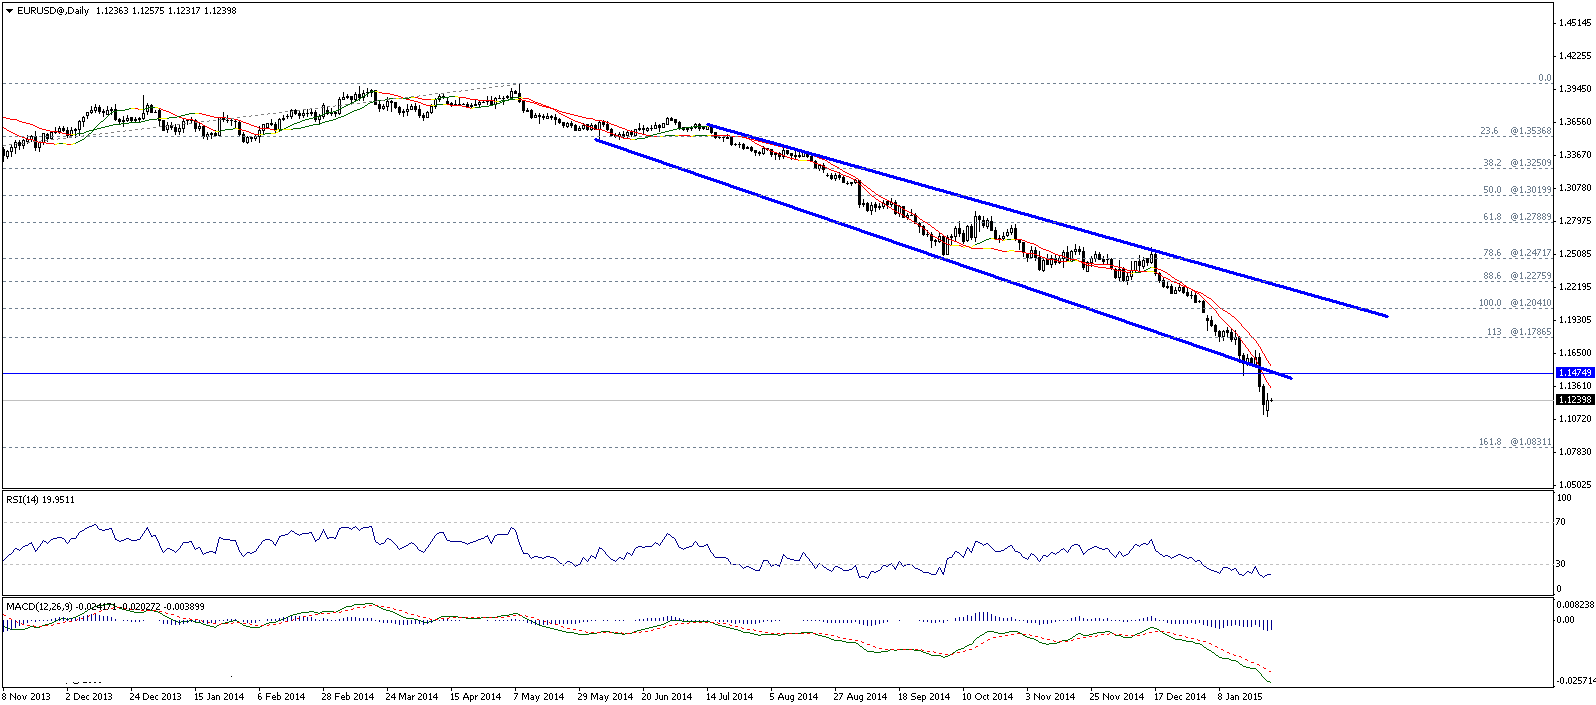
EUR/USD Daily Chart

The pair failed to breach 1.1300 levels and dropped again, while stabilizing below the referred to level is negative and support the downside move. Breaking 1.1200 and holding below it extends bearishness to target 1.1100. Breaking the latter and stabilizing below it triggers a bearish wave that targets 1.1020 and 1.0830.

Trading below 1.1300 is negative and support the downside move, while breaching 1.1370 threatens to fail the suggested expectations.

EUR/USD Support And Resistance

GBP/USD - European Session

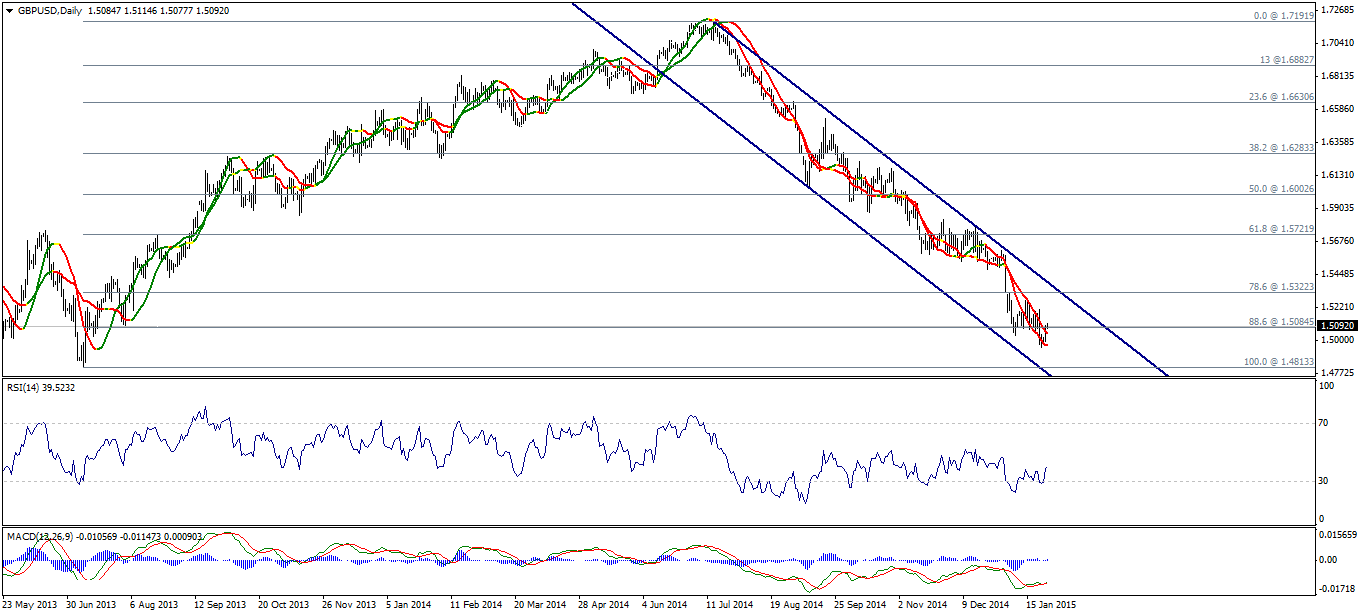
GBP/USD Daily Chart

The pair moved back to the upside above 1.5085 which is positive, then traded again above Linear Regression Indicators. In fact, trading now above the psychological barrier 1.5000 is positive and could push the pair further to the upside, while a break above 1.5130 confirms this positive outlook.

RSI is getting in an upside trend again, and despite that Linear Regression Indicators are still negative, trading above it gives it bullish momentum.

GBP/USD Support And Resistance

USD/JPY - Technical Report

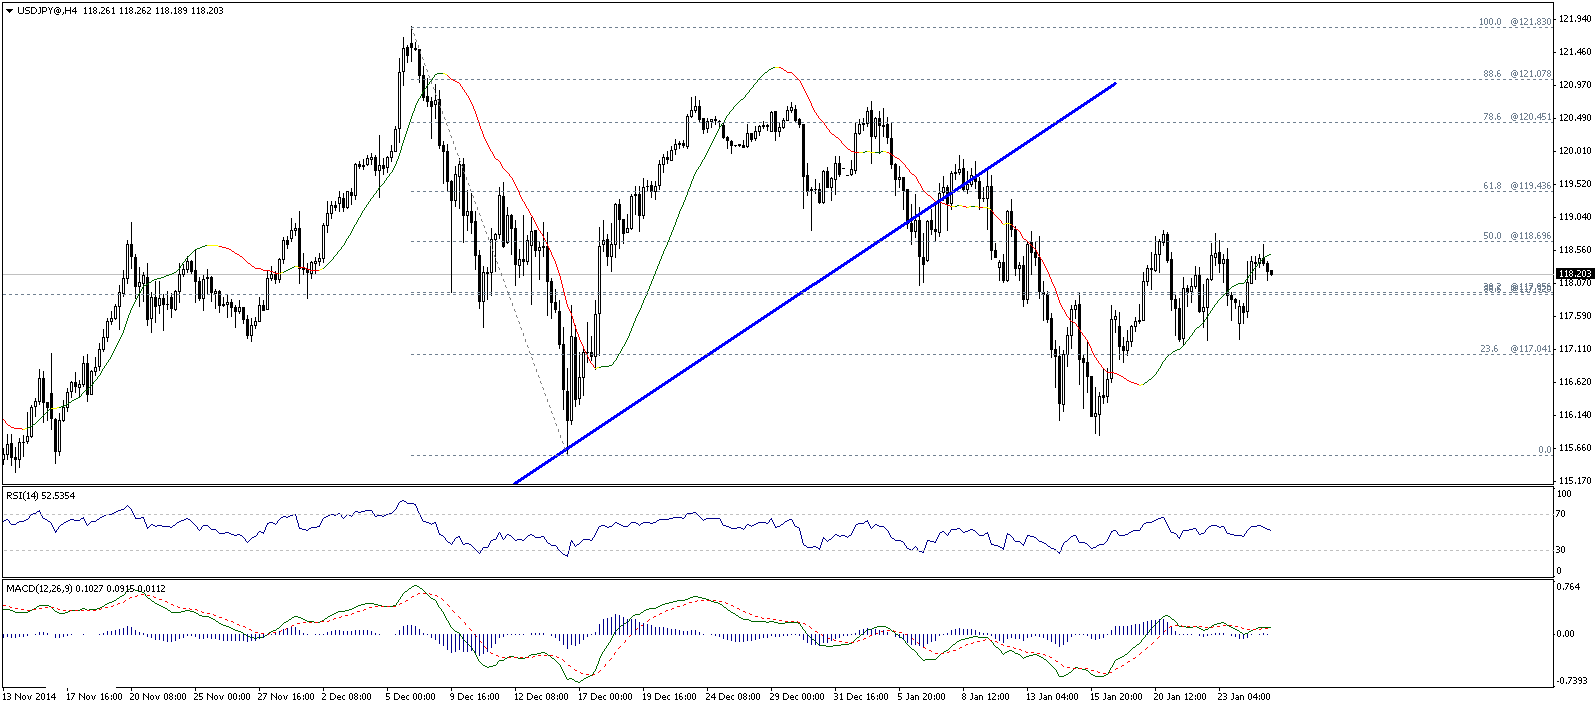
USD/JPY 4-Hour Chart

The pair is still trading around 118.25 and stabilizing above it confirms the upside move and extends it targeting 119.05 and 119.70 and 120.45, while breaking 116.90 threatens to fail the suggested expectations.

USD/JPY Support And Resistance

USD/CHF - Technical Report

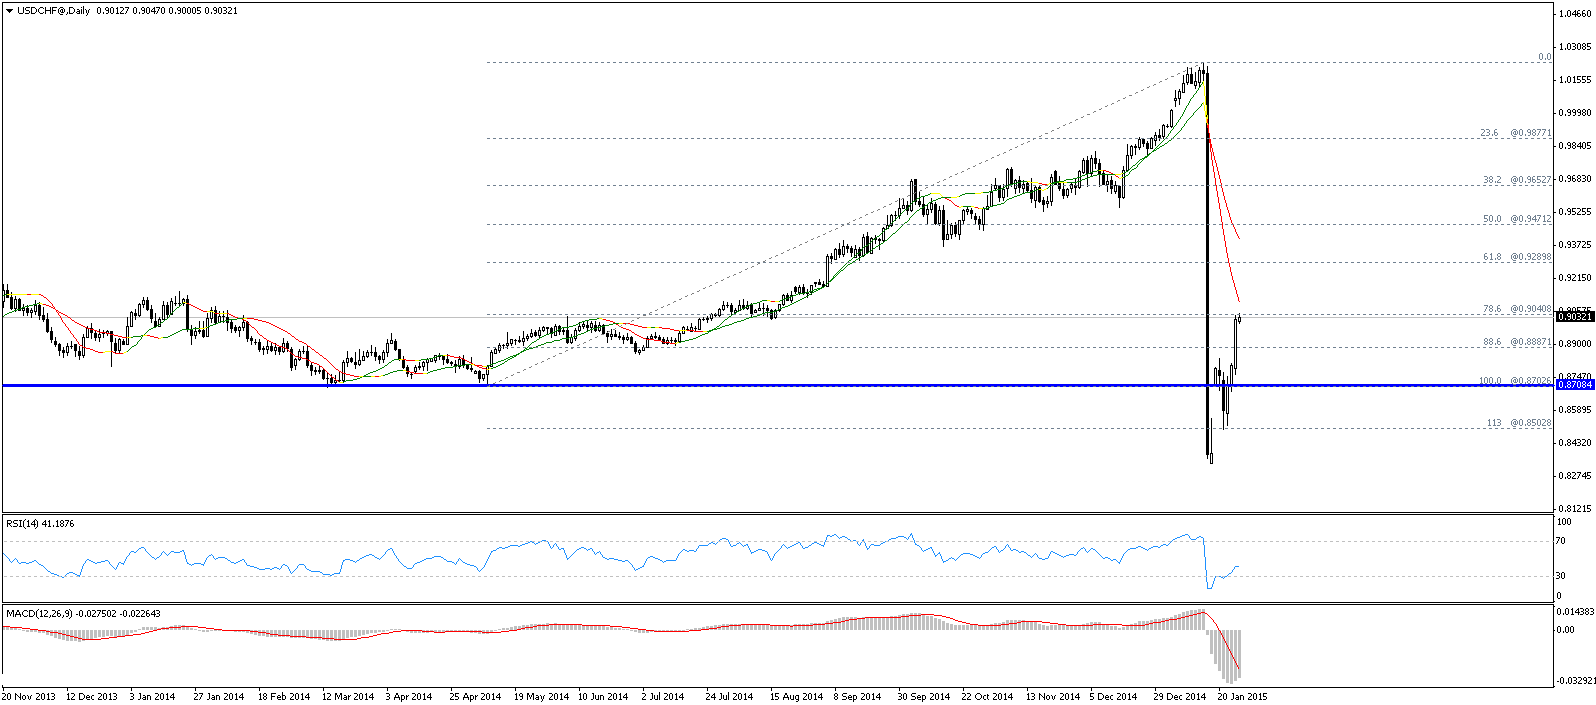
USD/CHF Daily Chart

The pair moved to the upside and breached 0.8890, pushing it to the next resistance at 0.9040. Breaching the referred to level and stabilizing above it extends the upside move in the coming period and triggers a new bullish wave.

3rd party Ad. Not an offer or recommendation by Investing.com. See disclosure here or remove ads .

USD/JPY Support And Resistance

USD/CAD - Technical Report

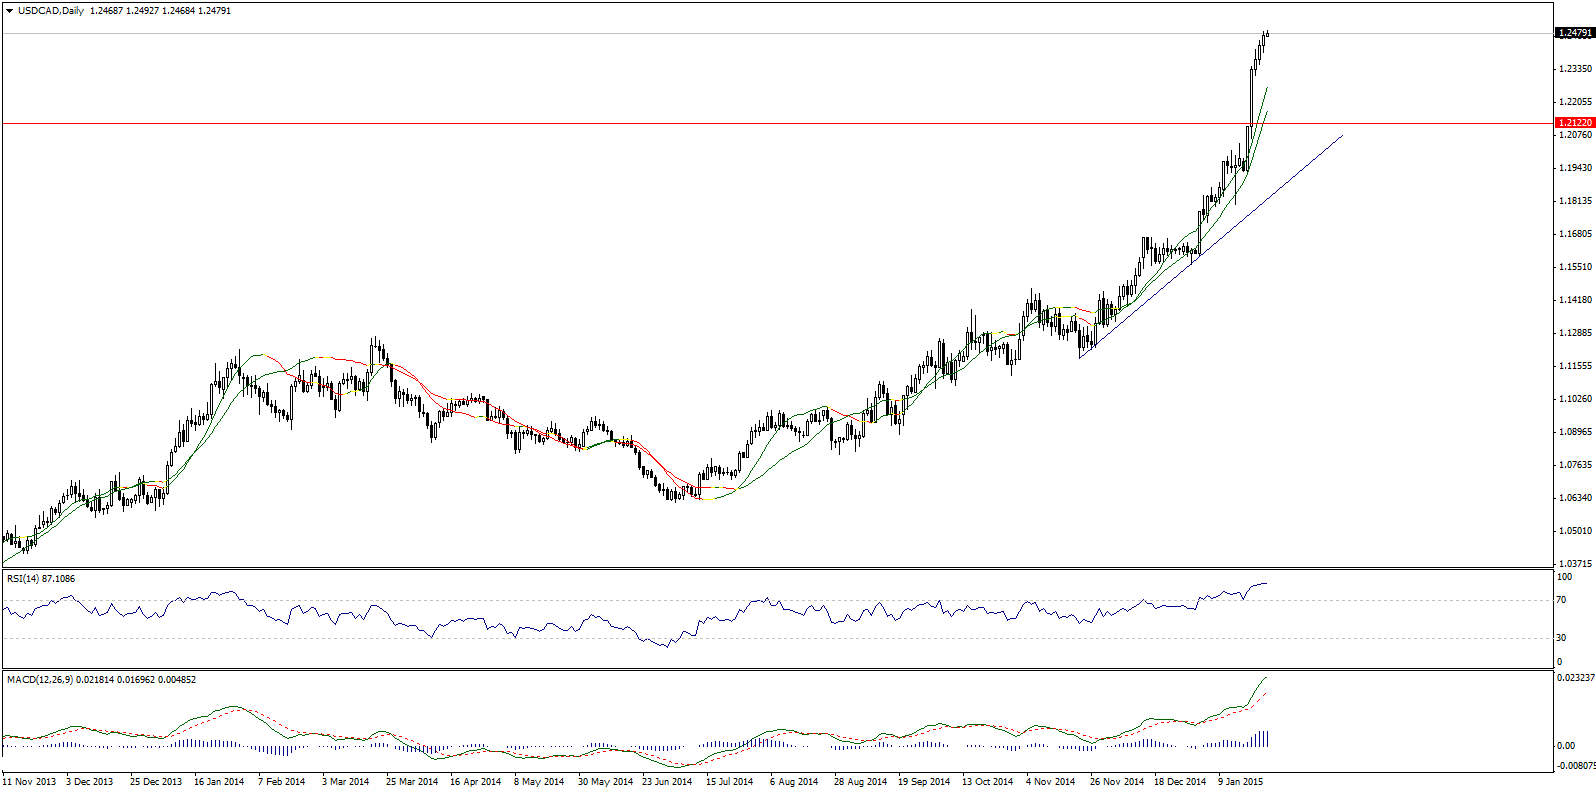
USD/CAD Daily Chart

The pair is moving to the upside supported by the positivity of Linear Regression Indicators, as RSI and MACD are trading in negative areas which could lead to a temporary negative volatility. Generally, the upside move is expected as long as the pair is stable above 1.2245 targeting next 1.2600.

USD/CAD Support And Resistance

AUD/USD - Technical Report

AUD/USD Daily Chart

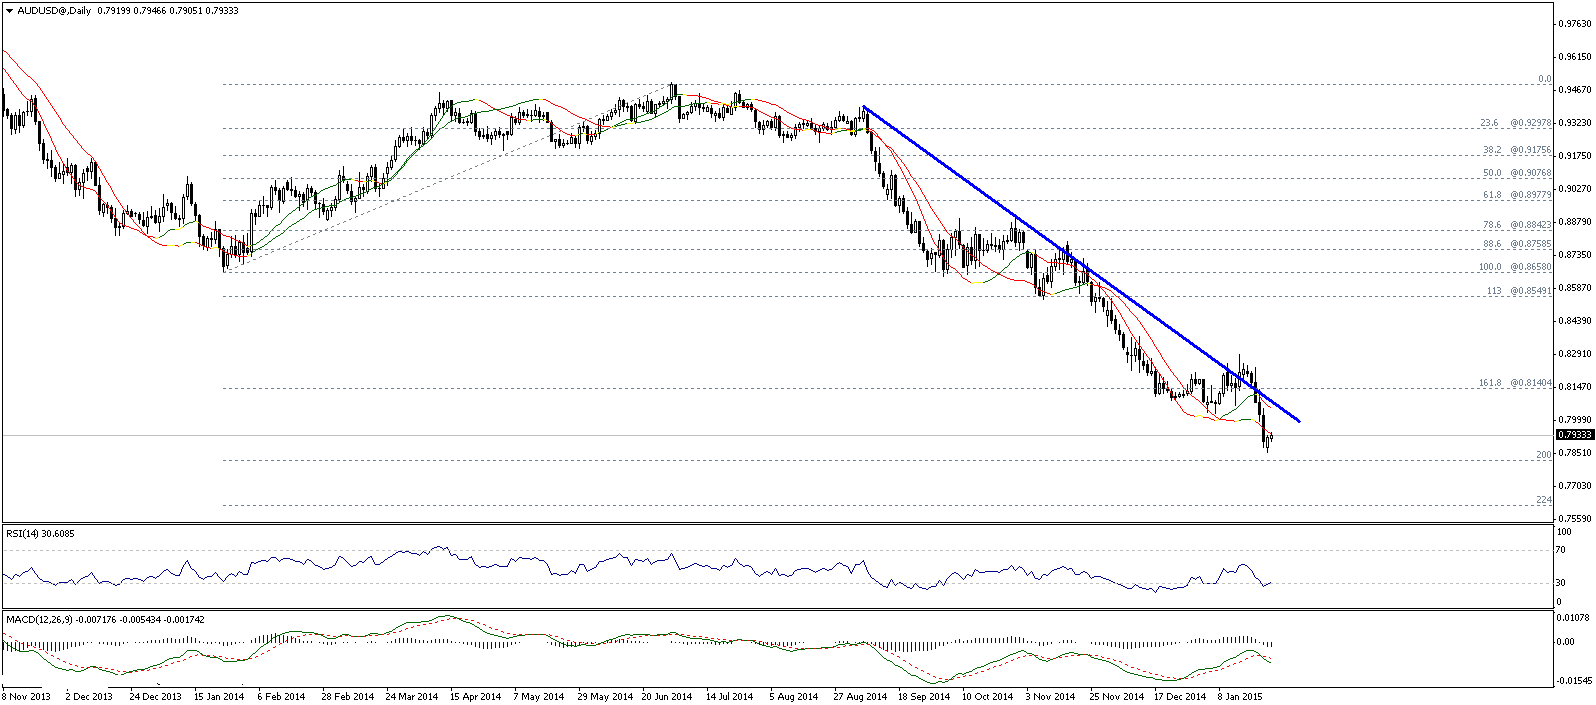
The pair moved to the upside and is trading above 0.7900, but we will keep our negative expectations, whereas the pair is still trading below 0.8000. Trading again below 0.7900 confirms the negative expectations and targets 0.7815, while breaching 0.8040 threatens to fail the suggested expectations.

AUD/USD Support And Resistance

NZD/USD - Technical Report

NZD/USD Daily Chart

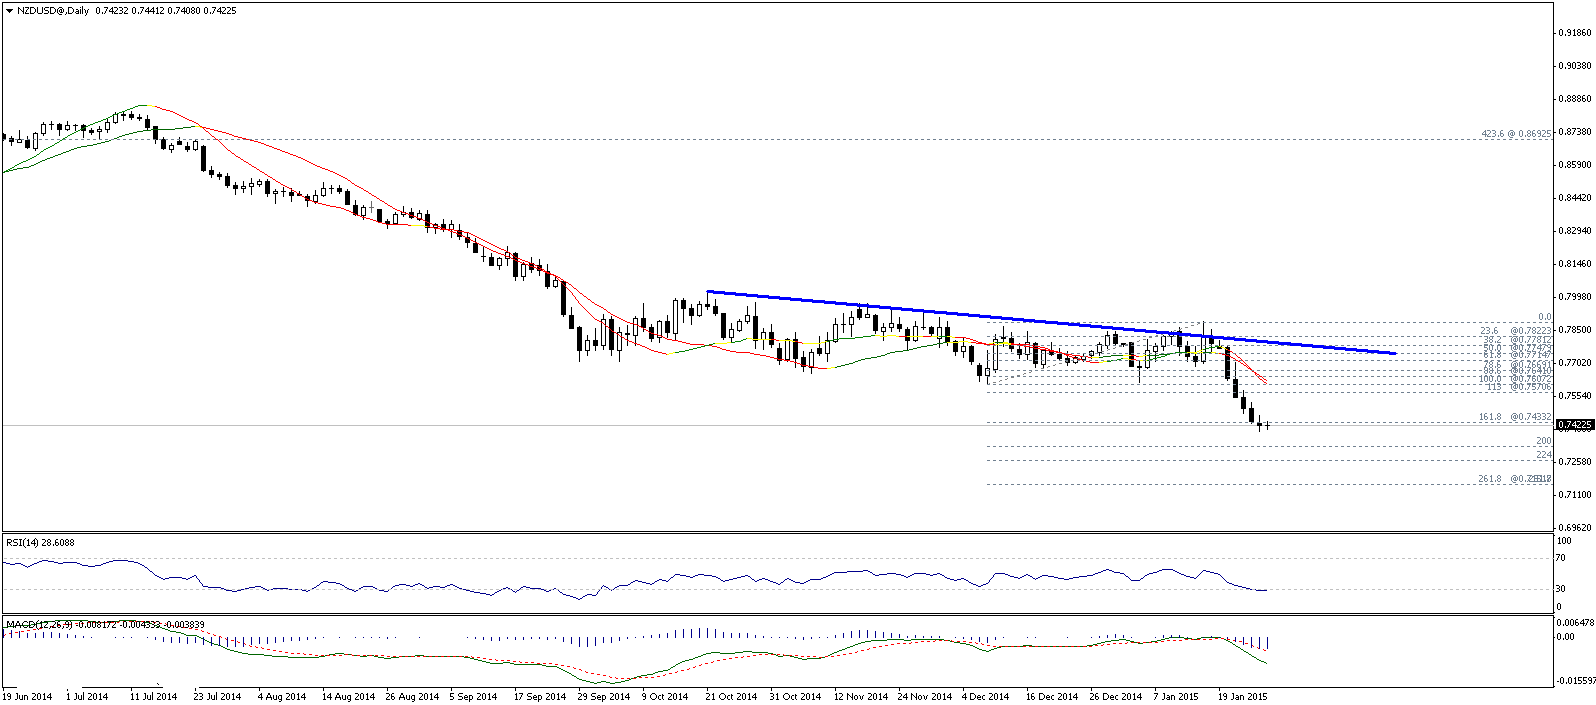
The pair moved back to the downside and broke 0.7430, as stability below this level is negative and favors extending the downside move in the coming period, while a break above 0.7570 threatens to fail the suggested expectations.

NZD/USD Support And Resistance

Latest comments

Risk Disclosure: Trading in financial instruments and/or cryptocurrencies involves high risks including the risk of losing some, or all, of your investment amount, and may not be suitable for all investors. Prices of cryptocurrencies are extremely volatile and may be affected by external factors such as financial, regulatory or political events. Trading on margin increases the financial risks.
Before deciding to trade in financial instrument or cryptocurrencies you should be fully informed of the risks and costs associated with trading the financial markets, carefully consider your investment objectives, level of experience, and risk appetite, and seek professional advice where needed.
Fusion Media would like to remind you that the data contained in this website is not necessarily real-time nor accurate. The data and prices on the website are not necessarily provided by any market or exchange, but may be provided by market makers, and so prices may not be accurate and may differ from the actual price at any given market, meaning prices are indicative and not appropriate for trading purposes. Fusion Media and any provider of the data contained in this website will not accept liability for any loss or damage as a result of your trading, or your reliance on the information contained within this website.
It is prohibited to use, store, reproduce, display, modify, transmit or distribute the data contained in this website without the explicit prior written permission of Fusion Media and/or the data provider. All intellectual property rights are reserved by the providers and/or the exchange providing the data contained in this website.
Fusion Media may be compensated by the advertisers that appear on the website, based on your interaction with the advertisements or advertisers.
© 2007-2024 - Fusion Media Limited. All Rights Reserved.