Get 40% Off
🚨 Volatile Markets? Find Hidden Gems for Serious Outperformance
Find Stocks Now

Daily Technical Report :September 14, 2015

Published 09/14/2015, 03:21 AM
Updated 07/09/2023, 06:31 AM

GBPUSD

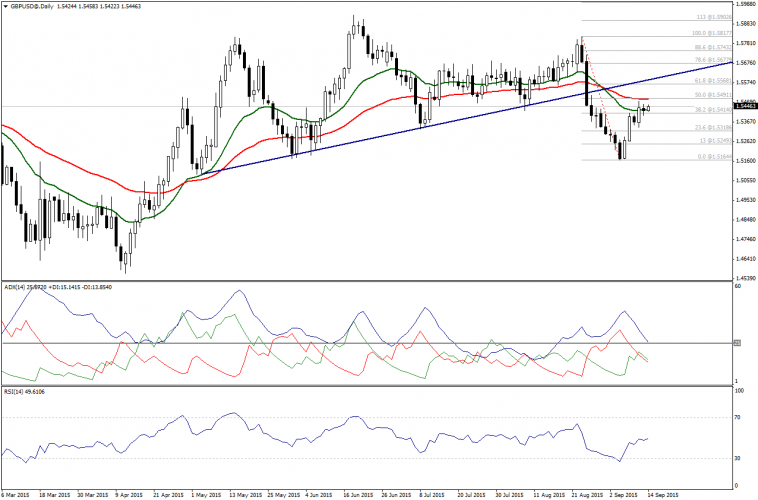
GBPUSD inclines gradually after stabilizing above 38.2% Fibonacci at 1.5410-1.5415.
GBPUSD Chart
Extending the bullishness is available, but the pair will face hard obstacle at 1.5490. This level should be breached to negate the negative sign on ADX and RSI14 approaching neutrality point at 50.00.

Support: 1.5415 – 1.5380 – 1.5335

Resistance: 1.5450 – 1.5490 – 1.5525

Direction: Up

EURUSD

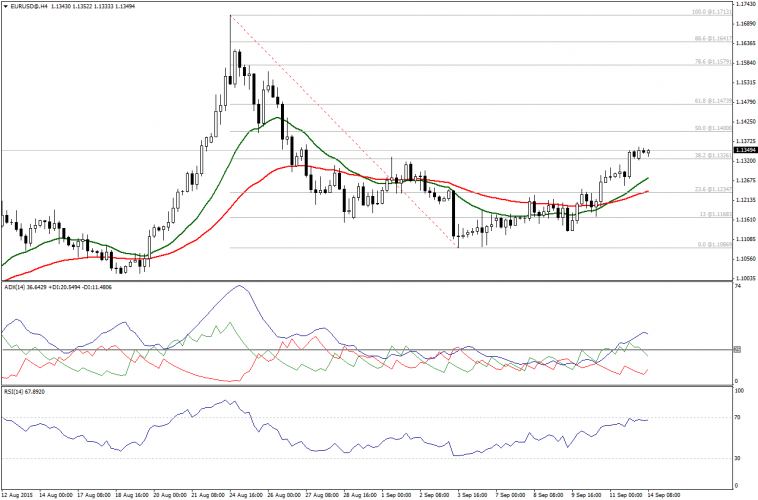
EURUSD is currently supported above 1.1325 (38.2% Fibonacci) and that is a good factor for buyers, opening the door towards 50% at 1.1400.
EURUSD Chart
A break above 1.1400 will accelerate the bullish tendencies towards 1.1475; noting that, this breakout is essential, as RSI is neutral and ADX shows signs of trend exhaustion.

Support: 1.1325 – 1.1280 – 1.1230

Resistance: 1.1360 –1.1400 – 1.1475

Direction: Up

USDCHF

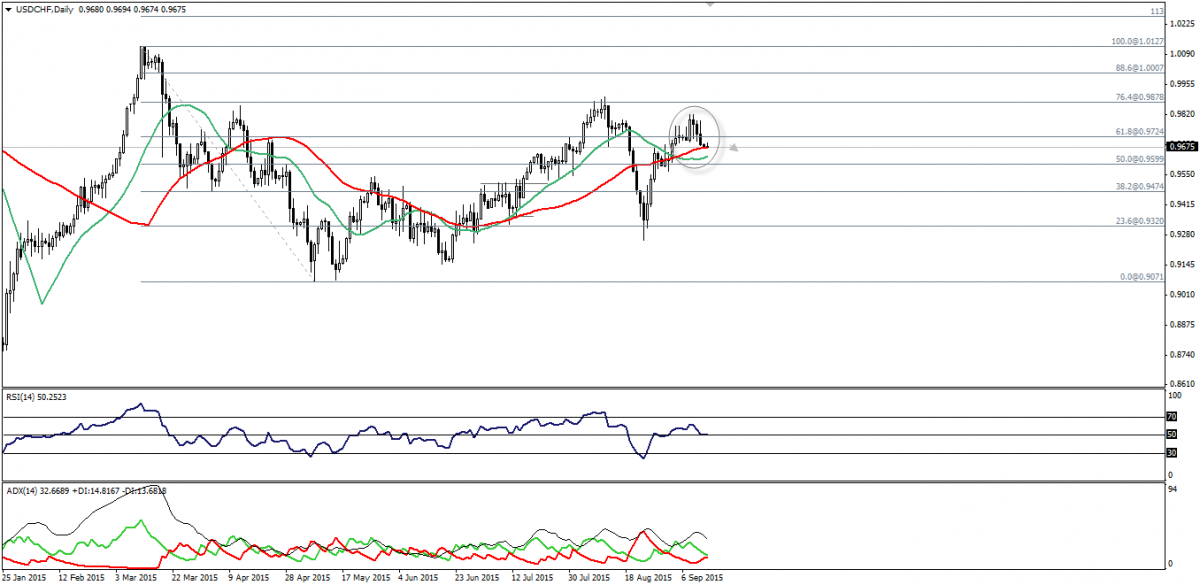
USDCHF has fallen sharply below 61.8% Fibonacci retracement ahead of the closing of the previous week.
USDCHF Chart
Currently, the pair is flirting with SMA50, but we will depend on failure at 0.9780 to suggest potential downside resumption, reinforced by the upside trend weakness appearing on ADX.

A break below 0.9630 will make the sign on RSI 14 stronger.

Support: 0.9620-0.9550-0.9500

Resistance:0.9750- 0.9780-0.9830

Direction: Bearish

USDJPY

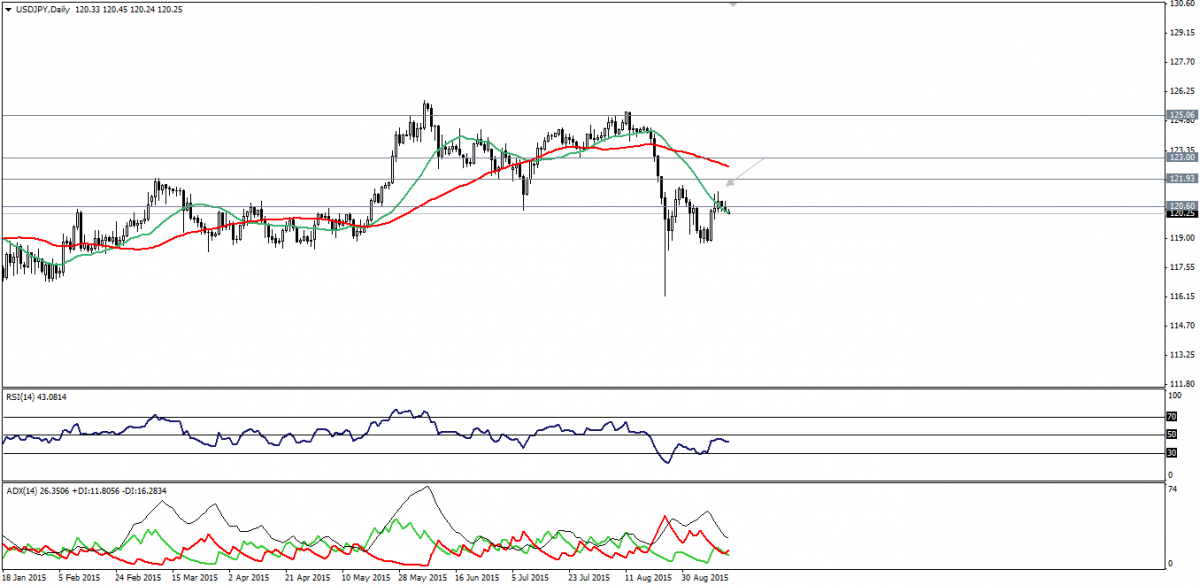
In line with our last technical comment on the USDJPY, the pair has moved to the downside, influenced by the upper shadows formed on the candlesticks of the second half of the previous week.
USDJPY Chart
Coming below SMA20 should bring further debasement over upcoming sessions, as ADX turns into negativity and RSI14 shows signs of momentum weakness.

Coming below 120.00 may accelerate and for subscriber, we hold onto our position.

3rd party Ad. Not an offer or recommendation by Investing.com. See disclosure here or remove ads .

Support: 120.00-119.30-118.85.

Resistance:120.60-121.00-121.75

Direction: Bearish

Latest comments

Risk Disclosure: Trading in financial instruments and/or cryptocurrencies involves high risks including the risk of losing some, or all, of your investment amount, and may not be suitable for all investors. Prices of cryptocurrencies are extremely volatile and may be affected by external factors such as financial, regulatory or political events. Trading on margin increases the financial risks.
Before deciding to trade in financial instrument or cryptocurrencies you should be fully informed of the risks and costs associated with trading the financial markets, carefully consider your investment objectives, level of experience, and risk appetite, and seek professional advice where needed.
Fusion Media would like to remind you that the data contained in this website is not necessarily real-time nor accurate. The data and prices on the website are not necessarily provided by any market or exchange, but may be provided by market makers, and so prices may not be accurate and may differ from the actual price at any given market, meaning prices are indicative and not appropriate for trading purposes. Fusion Media and any provider of the data contained in this website will not accept liability for any loss or damage as a result of your trading, or your reliance on the information contained within this website.
It is prohibited to use, store, reproduce, display, modify, transmit or distribute the data contained in this website without the explicit prior written permission of Fusion Media and/or the data provider. All intellectual property rights are reserved by the providers and/or the exchange providing the data contained in this website.
Fusion Media may be compensated by the advertisers that appear on the website, based on your interaction with the advertisements or advertisers.
© 2007-2024 - Fusion Media Limited. All Rights Reserved.