⌛ Did you miss ProPicks’ 13% gains in May? Subscribe now & catch June’s top AI-picked stocks early.Unlock Stocks

USD/JPY Trading Below Resistance; Sterling Fails To Incline

Published 05/23/2016, 06:51 AM
Updated 07/09/2023, 06:31 AM
EUR/USD
-
GBP/USD
-
USD/JPY
-
USD/CHF
-

USD/JPY

USD/JPY is still trading below the initial resistance of 110.60-110.70 despite trading above moving averages 50 and 50 as seen on the provided daily chart.
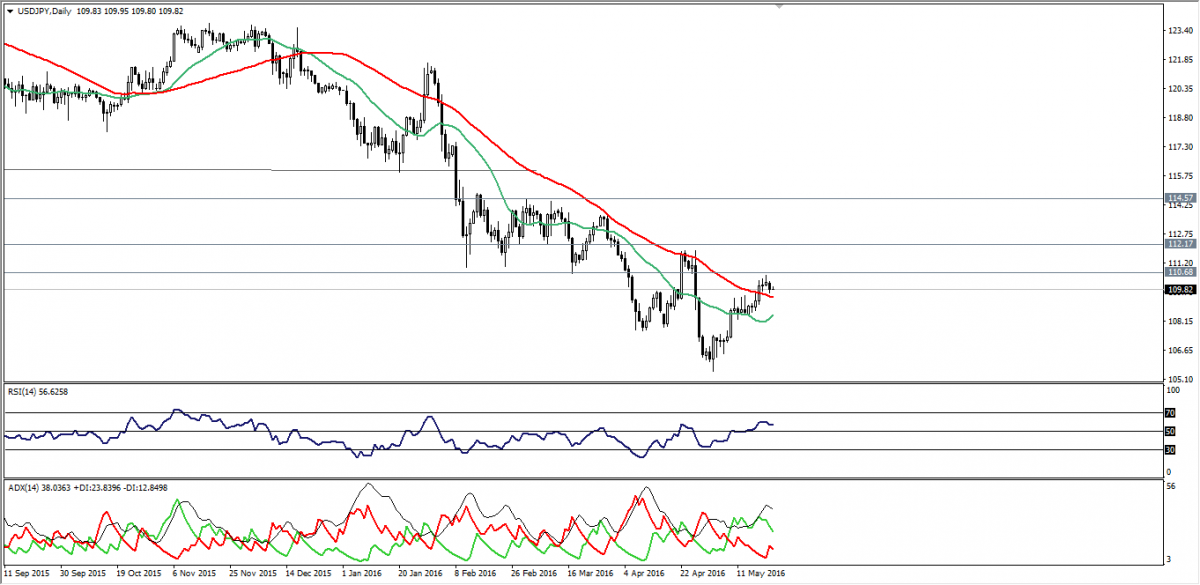
USD/JPY Daily Chart

Strength of the upside recovery is being lost gradually as seen on ADX, while trading between SMA50-red- and the aforementioned resistance makes risk versus reward ratio inappropriate.

On the downside, coming below 109.60 and 109.40 respectively could expose moving averages.

Support: 109.60-109.20-108.90

Resistance: 110.30-110.60-111.10

Direction: Neutral

USD/CHF

As discussed many times last week, USD/CHF has soared respecting the bullish scenario after clearing 0.9790-0.9780 regions.
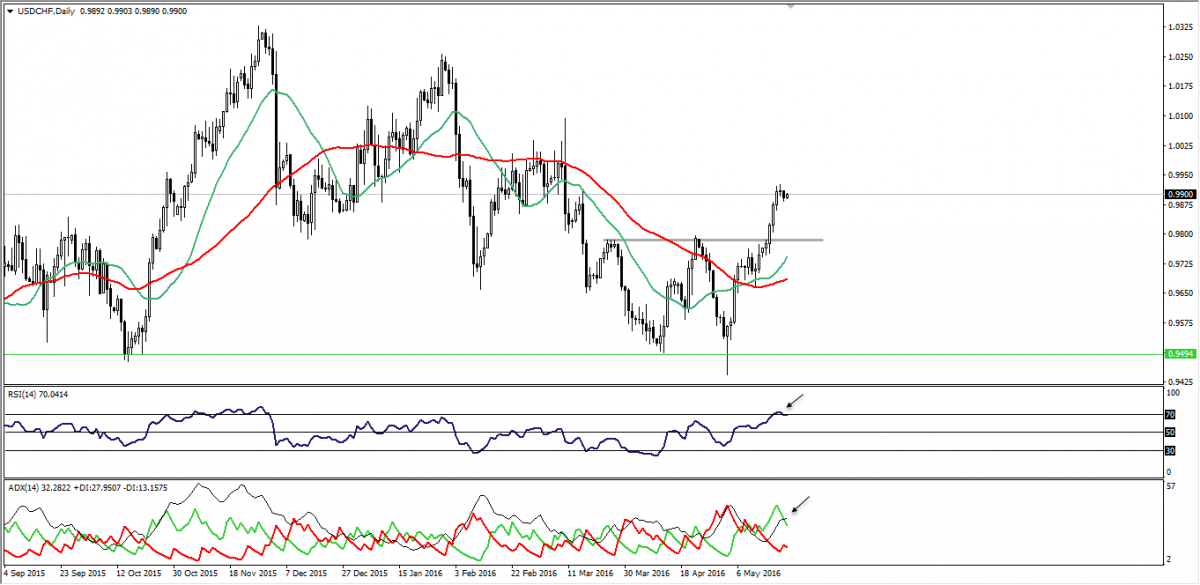
USD/CHF Daily Chart

Actually, reaching the current trading levels was very easy supported by strength of US dollar against all majors, but the inclines have taken RSI14 to move deeply inside the overbought territories.

This signal on RSI in addition to the mild weakness appearing on ADX contradict with the positivity over bigger time-frames.

We will be neutral until risk versus reward ratio becomes appropriate enough to enter the market, while 0.9850 and 0.9980 are important levels to be watched out.

Support: 0.9860-0.9805-0.9780

Resistance: 0.9945-0.9980-1.0000

Direction: Neutral

EUR/USD

Euro inclined with the European opening today, trading above 50% Fibonacci at 1.1215-1.1220, which is positive, but it remains limited below 38.2% Fibonacci at 1.1315 and below moving averages.
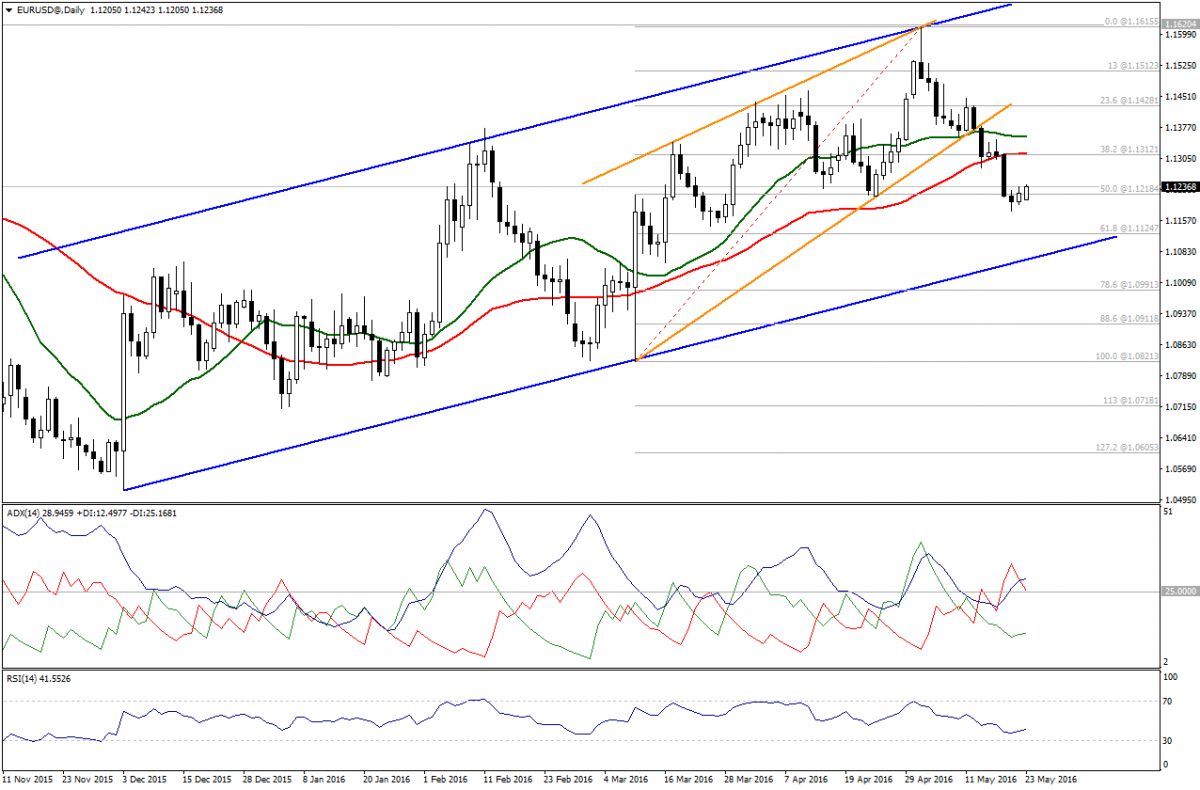
EUR/USD Daily Chart

ADX shows decrease in bears’ power, but without showing positivity, while RSI moves below 50.00. Hence, we prefer to be neutral today.

Support: : 1.1215 – 1.1170 – 1.1125

Resistance: 1.1285 –1.1320 – 1.1355

Direction: Neutral

GBP/USD

Sterling failed to incline after touching SMA20 around 1.4535 where it declined again to hover around 38.2% Fibonacci at 1.4500.
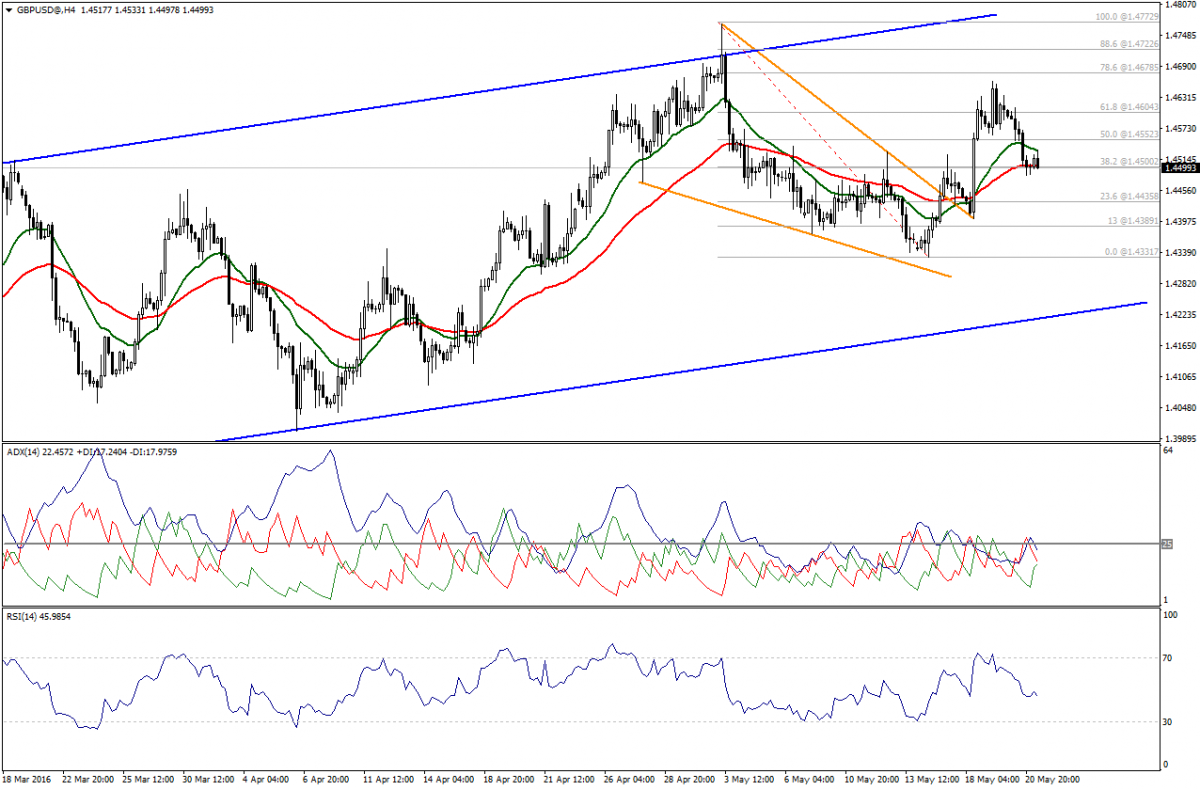
GBP/USD 4-Hour Chart

RSI remains negative along with weak attempt to achieve positive crossover, but D+ is weak.

We will be bearish with a break below 1.4475 and trading below 1.4500 is bearish, protected by 1.4605.

Support: 1.4500 – 1.4475 – 1.4435

Resistance:1.4535– 1.4590– 1.4605

Direction: Bearish

Latest comments

Loading next article…
Risk Disclosure: Trading in financial instruments and/or cryptocurrencies involves high risks including the risk of losing some, or all, of your investment amount, and may not be suitable for all investors. Prices of cryptocurrencies are extremely volatile and may be affected by external factors such as financial, regulatory or political events. Trading on margin increases the financial risks.
Before deciding to trade in financial instrument or cryptocurrencies you should be fully informed of the risks and costs associated with trading the financial markets, carefully consider your investment objectives, level of experience, and risk appetite, and seek professional advice where needed.
Fusion Media would like to remind you that the data contained in this website is not necessarily real-time nor accurate. The data and prices on the website are not necessarily provided by any market or exchange, but may be provided by market makers, and so prices may not be accurate and may differ from the actual price at any given market, meaning prices are indicative and not appropriate for trading purposes. Fusion Media and any provider of the data contained in this website will not accept liability for any loss or damage as a result of your trading, or your reliance on the information contained within this website.
It is prohibited to use, store, reproduce, display, modify, transmit or distribute the data contained in this website without the explicit prior written permission of Fusion Media and/or the data provider. All intellectual property rights are reserved by the providers and/or the exchange providing the data contained in this website.
Fusion Media may be compensated by the advertisers that appear on the website, based on your interaction with the advertisements or advertisers.
© 2007-2024 - Fusion Media Limited. All Rights Reserved.