Get 40% Off
🚨 Volatile Markets? Find Hidden Gems for Serious Outperformance
Find Stocks Now

USD/JPY Moves To Downside, But Quickly Retraces

Published 03/01/2016, 05:29 AM
Updated 07/09/2023, 06:31 AM

USD/JPY

USD/JPY has moved to the downside, but it retraced quickly from 112.05 zones during the Asian session today to currently approach SMA20 at 113.10.
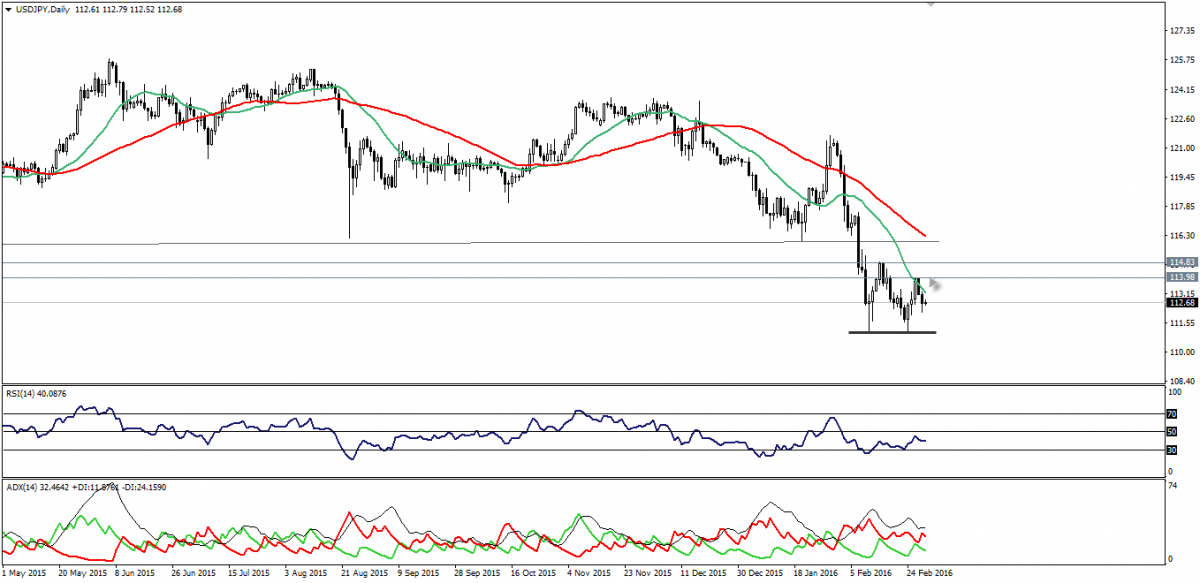
USD/JPY Daily Chart

Actually, the technical situation remains very sensitive, as technical indicators don’t give off any reliable signals and we need to see how the USDJPY will behave around 113.00 from the topside or 112.05 from the underside to follow through.

Due to the inappropriate risk versus reward ratio now, we will be neutral and we will update once we catch a reliable sign.

Support: 112.50-112.30-111.90

Resistance: 113.00-113.30-113.65

Direction: Neutral

USD/CHF

Once again, the USD/CHF has failed to maintain levels above 1.0000 psychological, which meets 38.2% Fibonacci as we mentioned many times earlier.
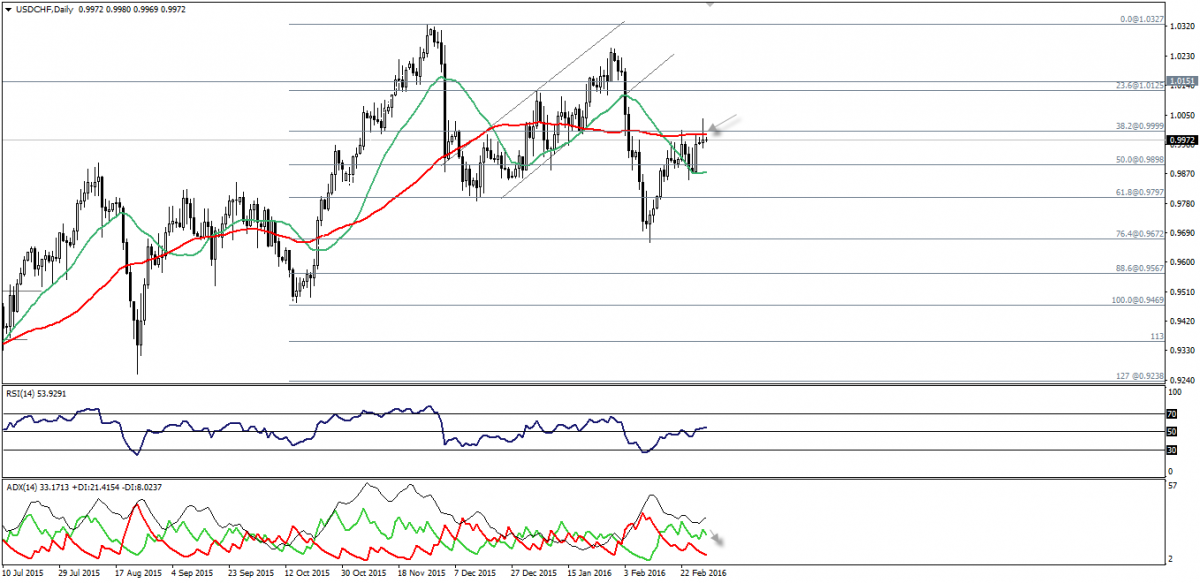
USD/CHF Daily chart

SMA50 -red- resides in the same regions and it has also capped the movements yesterday, while ADX started to show weaker signs for the upside trend.

We remain neutral as far as the pair is trapped between 0.9900 and 1.0000.

Support: 0.9930-0.9900-0.9870

Resistance: 1.0000-1.0050-1.0080

Direction: Neutral between 0.9900 and 1.0000

EUR/USD

EURO traded near 78.6% Fibonacci at 1.0850, which the suggested target for the bearishness.
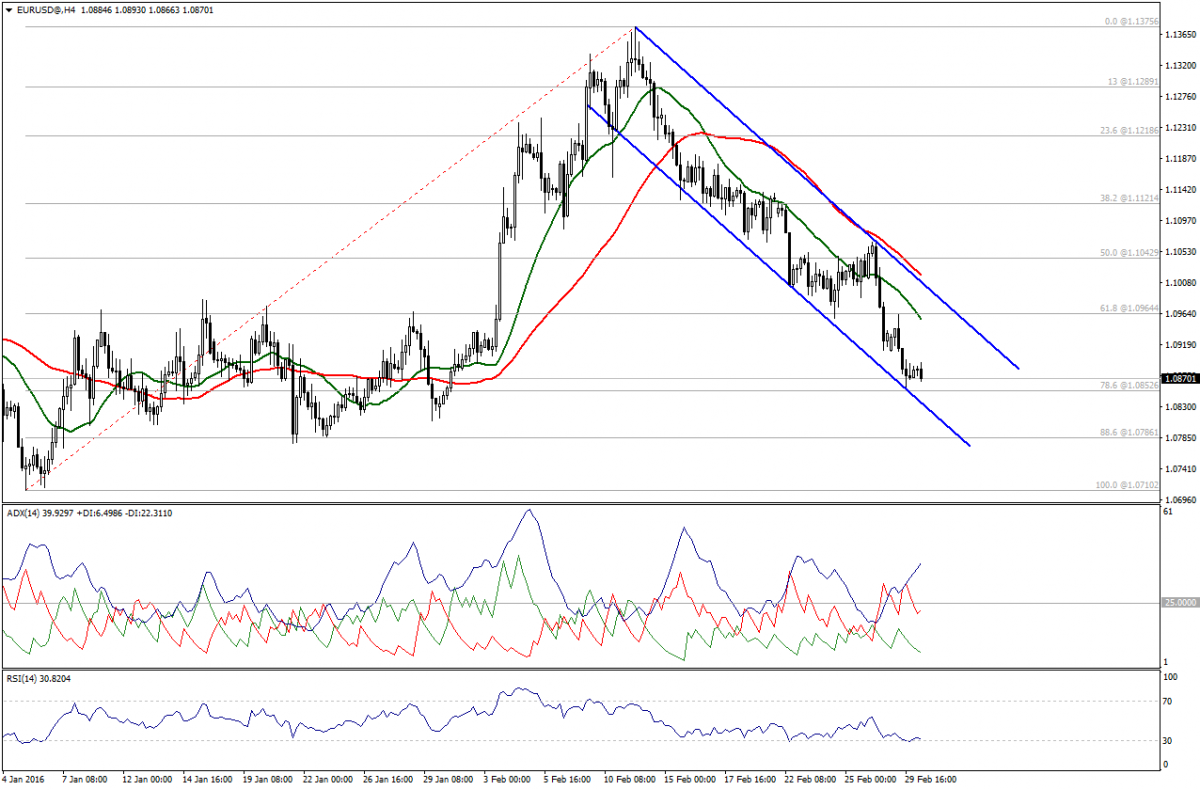
EUR/USD 4-Hour Chart

RSI shows oversold sign and that prevents us from being bearish today, as it is close to the support of the channel. We will be neutral now to see how the pair will behave around this level.

Support: 1.0850 – 1.0800 – 1.0785

Resistance: 1.0920 –1.0965 – 1.1000

Direction: Neutral

GBP/USD

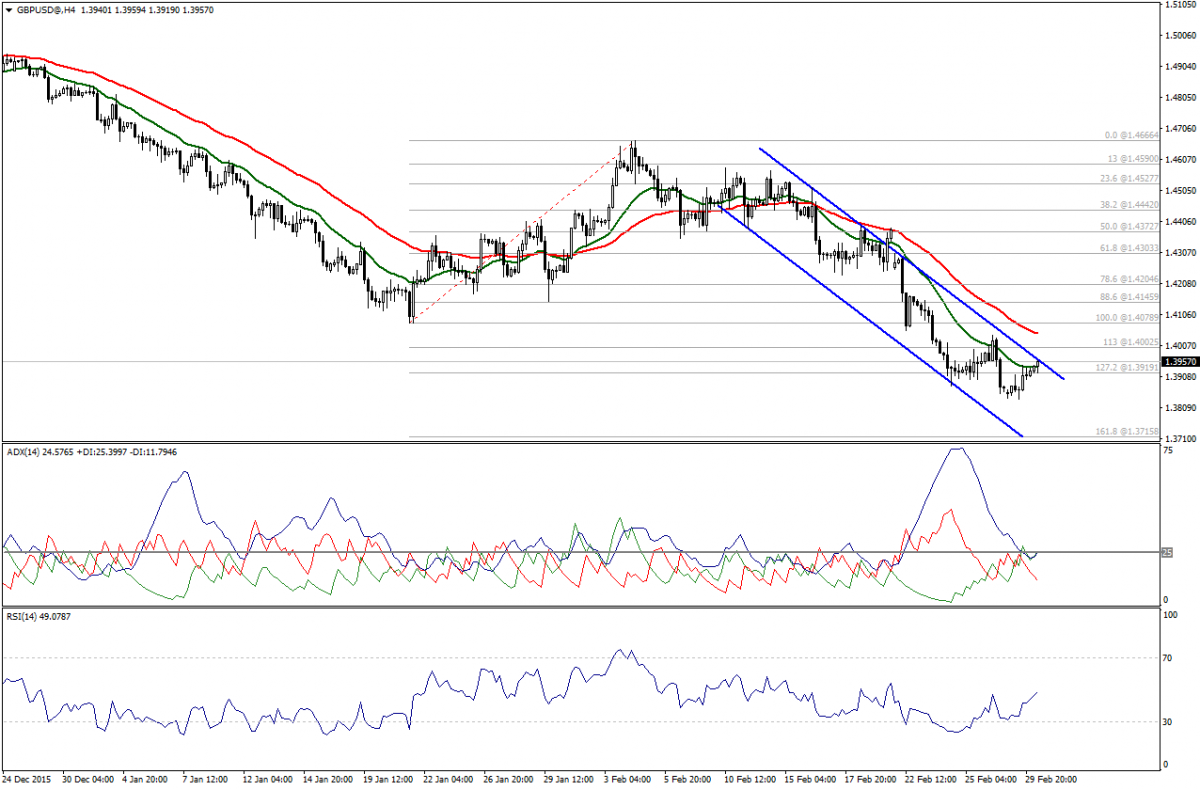
Yesterday’s bullishness has taken the pair above 1.3920-Fibonacci of 127.2%-, which caused failure to the bearishness over intraday basis, but we can’t affirm a new upside reversal until we see a breakout above 1.4005.
3rd party Ad. Not an offer or recommendation by Investing.com. See disclosure here or remove ads .

GBP/USD 4-Hour Chart

ADX shows bullish tendencies, while RSI inches higher, but it is still moving below 50.00 levels.

Prices move within the bearish channel and thus, we need a confirmation with a break above 1.4005.

Support: 1.3920 – 1.3870 – 1.3835

Resistance: 1.3960 – 1.4005 – 1.4080

Direction: Neutral

Latest comments

Risk Disclosure: Trading in financial instruments and/or cryptocurrencies involves high risks including the risk of losing some, or all, of your investment amount, and may not be suitable for all investors. Prices of cryptocurrencies are extremely volatile and may be affected by external factors such as financial, regulatory or political events. Trading on margin increases the financial risks.
Before deciding to trade in financial instrument or cryptocurrencies you should be fully informed of the risks and costs associated with trading the financial markets, carefully consider your investment objectives, level of experience, and risk appetite, and seek professional advice where needed.
Fusion Media would like to remind you that the data contained in this website is not necessarily real-time nor accurate. The data and prices on the website are not necessarily provided by any market or exchange, but may be provided by market makers, and so prices may not be accurate and may differ from the actual price at any given market, meaning prices are indicative and not appropriate for trading purposes. Fusion Media and any provider of the data contained in this website will not accept liability for any loss or damage as a result of your trading, or your reliance on the information contained within this website.
It is prohibited to use, store, reproduce, display, modify, transmit or distribute the data contained in this website without the explicit prior written permission of Fusion Media and/or the data provider. All intellectual property rights are reserved by the providers and/or the exchange providing the data contained in this website.
Fusion Media may be compensated by the advertisers that appear on the website, based on your interaction with the advertisements or advertisers.
© 2007-2024 - Fusion Media Limited. All Rights Reserved.