Get 40% Off
🎁 Free Gift Friday: Copy Legendary Investors' Portfolios in One ClickCopy for Free

USD/JPY Continues Fall, EUR/USD Attempts To Stabilize

Published 01/26/2016, 04:59 AM
Updated 07/09/2023, 06:31 AM

USD/JPY

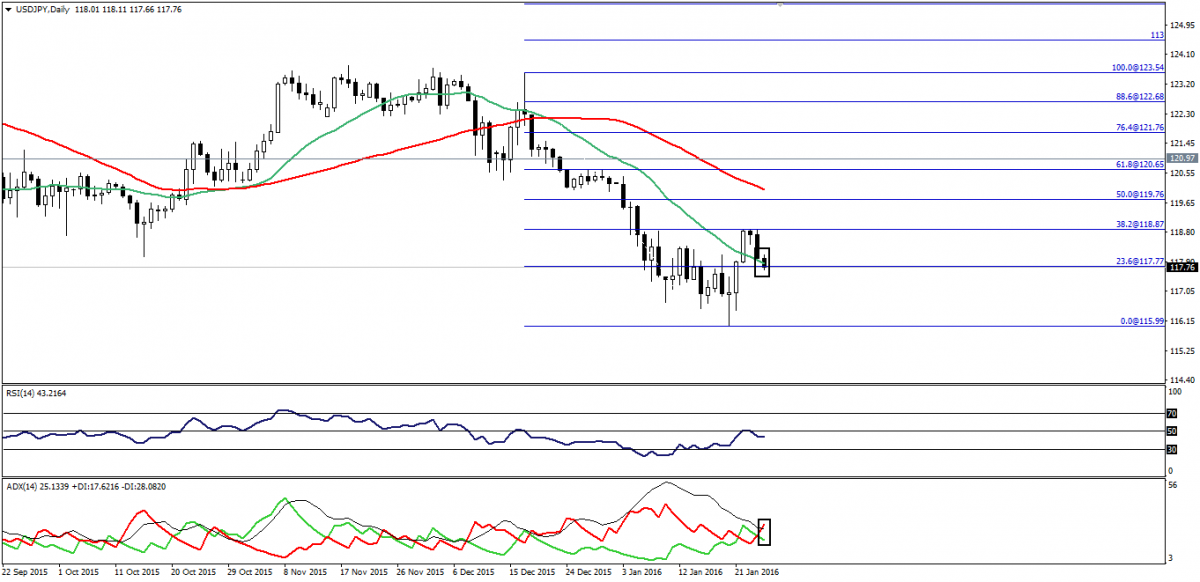
USD/JPY has been resisted at 118.85 zones where it declined and continued to fall during the Asian session, re-attacking 117.80, which is the key for more bearish intraday actions.
USD/JPY Daily Chart

ADX started to be negative although the strength signal isn’t enough to affirm the negativity, but the bearish crossover is a good signal for bears.

We will be bearish today; noting that, a break below 117.30 will confirm and accelerate.

Support: 117.30-116.80-116.15

Resistance: 118.00-118.30-118.85

Direction: Bearish

USD/CHF

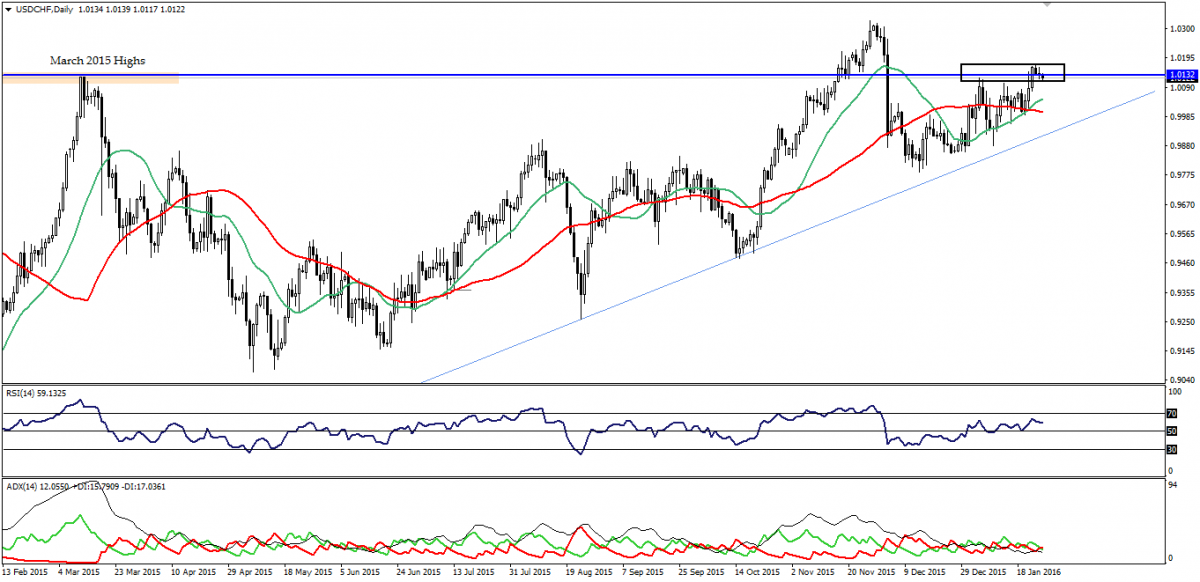
Struggle continued very close to 1.0130-1.0135 , which are very sensitive areas as seen on the provided daily chart.
USD/CHF Daily Chart

Momentum and trend indicators don’t give off any sign that we can depend on to suggest potential direction.

Hence, we will be on the sidelines today, as risk versus reward ratio seems to be inappropriate for intraday trading.

On the downside, a break below 1.0060-1.0055 will actuate bears to add more shorts.

Support: 1.0100-1.0050-1.0030

Resistance: 1.0135- 1.0180-1.0220

Direction: Sideways

EUR/USD

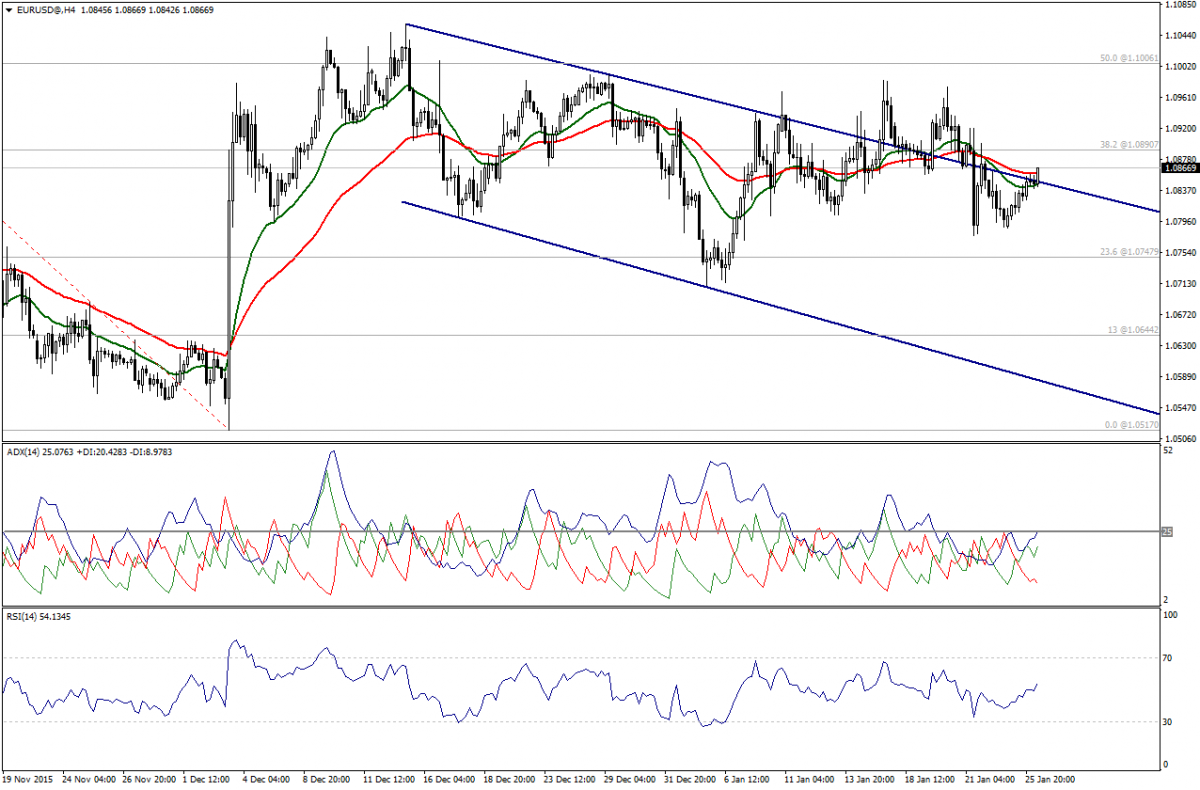
EUR/USD attempts to stabilize above moving averages and above the main resistance of the bearish trend at 1.0850, while ADX moves positively and RSI breaks 50.00 levels.
EUR/USD 4-Hour Chart

Hence, we are bullish, but we need a breakout above 1.0890 followed by 1.0935 to affirm the bullishness; noting that, any trading above 1.0790 is positive.

A break below 1.0790 will make us change our overview; thus, we will not recommend any positions now due to the sensitivity of current trading levels.

Support:1.0790 – 1.0850 – 1.0745

Resistance:1.0890 –1.0935 – 1.0985

3rd party Ad. Not an offer or recommendation by Investing.com. See disclosure here or remove ads .

Direction: Bullish, but we will avoid trading now.

GBP/USD

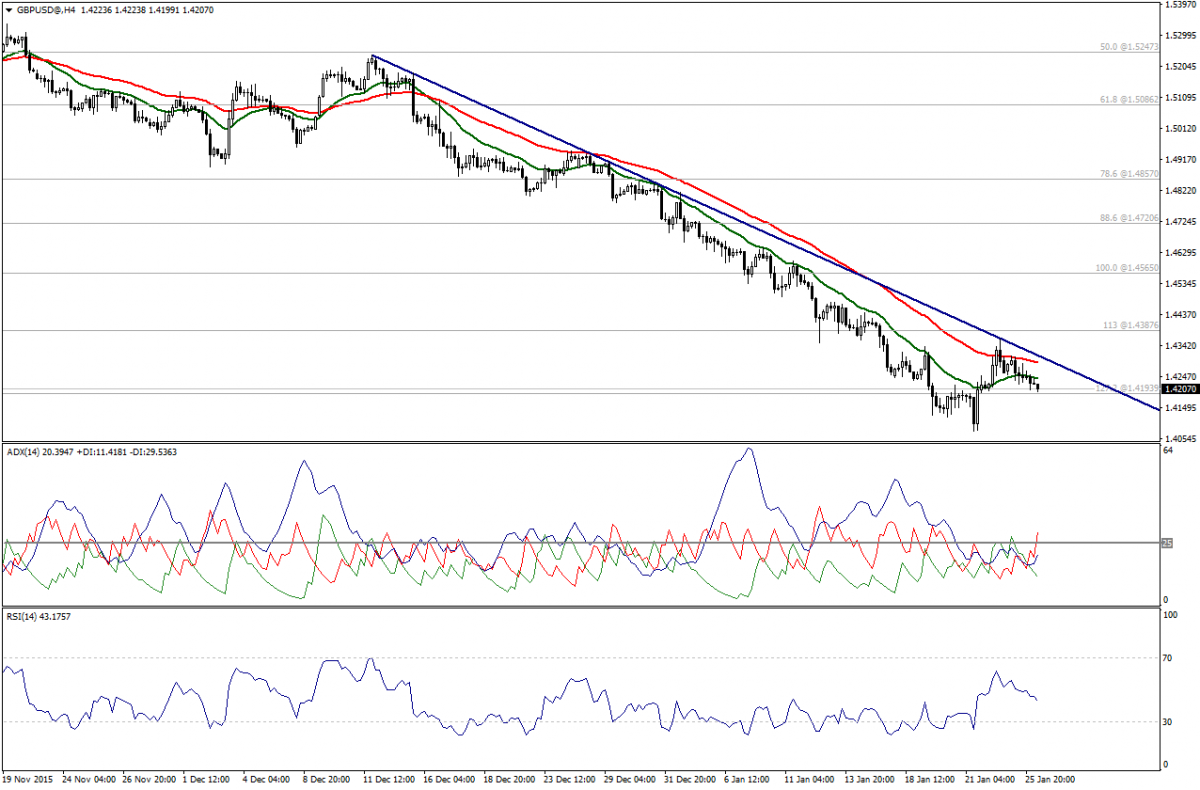
Strong increase in bulls’ power has been seen on ADX of the four-hour interval along with breakout attempt below 1.4190 where 127.2% Fibonacci exists.
GBP/USD 4-Hour Chart

A break below this level is essential to affirm the bearishness, but RSI shows the ability to breach the value of 50.00, which is a negative signal.

We will be bearish, but 1.4190 is the key for resuming the downtrend.

Support: 1.4190 – 1.4100 – 1.4060

Resistance:1.4245 – 1.4290 – 1.4390

Direction: Bearish with confirmation below 1.4190

Latest comments

Risk Disclosure: Trading in financial instruments and/or cryptocurrencies involves high risks including the risk of losing some, or all, of your investment amount, and may not be suitable for all investors. Prices of cryptocurrencies are extremely volatile and may be affected by external factors such as financial, regulatory or political events. Trading on margin increases the financial risks.
Before deciding to trade in financial instrument or cryptocurrencies you should be fully informed of the risks and costs associated with trading the financial markets, carefully consider your investment objectives, level of experience, and risk appetite, and seek professional advice where needed.
Fusion Media would like to remind you that the data contained in this website is not necessarily real-time nor accurate. The data and prices on the website are not necessarily provided by any market or exchange, but may be provided by market makers, and so prices may not be accurate and may differ from the actual price at any given market, meaning prices are indicative and not appropriate for trading purposes. Fusion Media and any provider of the data contained in this website will not accept liability for any loss or damage as a result of your trading, or your reliance on the information contained within this website.
It is prohibited to use, store, reproduce, display, modify, transmit or distribute the data contained in this website without the explicit prior written permission of Fusion Media and/or the data provider. All intellectual property rights are reserved by the providers and/or the exchange providing the data contained in this website.
Fusion Media may be compensated by the advertisers that appear on the website, based on your interaction with the advertisements or advertisers.
© 2007-2024 - Fusion Media Limited. All Rights Reserved.