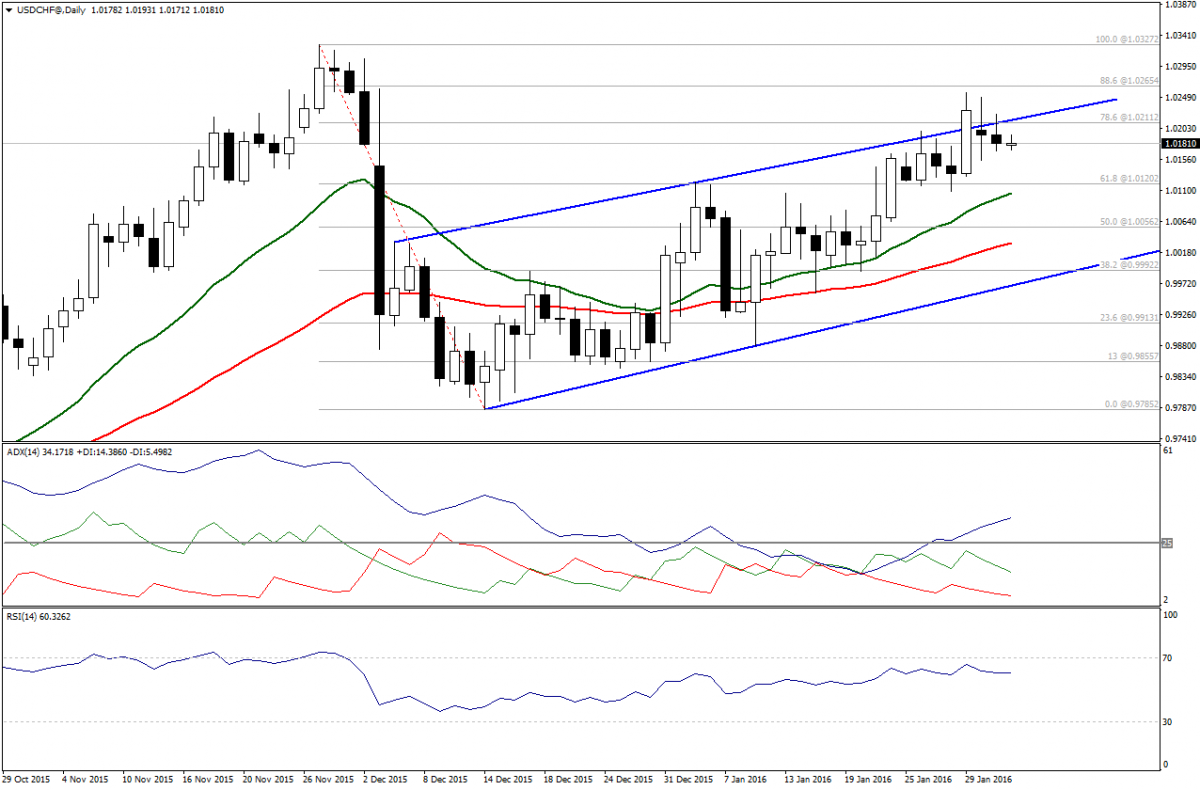
It is clear that the pair is trading below 78.6% Fibo level located at 1.0210 and below the key resistance related to the upside direction.

The failure to breach 1.0210 and the stability above by a daily closing is considered bearish, while it may be a reason for some downside attempts. But, the breakout of support at 1.0135, followed by the breakout of 61.8% Fibo at 1.0120 would support further bearishness. From the upside, only the breach of 1.0265 would fail this intraday bearish scenario for today.
Support: 1.0175-1.0135-1.0110
Resistance: 1.0210-1.0265-1.0320
Pair’s direction: Downside
Notice: Our trading position is revealed for subscribers at the top of this report
The SMA 50 located at 119.50 managed to stop the bearish direction for the USDJY pair, but negativity still strongly appears on both ADX and RSI indicators.
The upside direction that occurred during the Asian session could be considered as a correction, which could extend a little bit. Yet, any trading below 120.80 would make the bearish possibility existing and would raise the chances of seeing an extension to the drop. From the downside, the breakout of 119.50 would activate a downside direction to retest 118.95. For our trading positions, we will wait for a while until the end of the correction and the reach of better levels in terms of risk to return.
- Support: 119.50-118.95-118.40
- Resistance: 119.85-120.20-120.80
Pair’s direction: Downside, but there could be some correction
Notice: Our trading position is revealed for subscribers at the top of this report
The British pair is attempting to widen its gains versus the U.S. dollar by rising further, amidst some positivity on the ADX indicator, the stability above the moving averages and above 23.6% Fibonacci at 1.4350.
But, we must refer to the importance of the breach of 1.4450 and the stability above it to guarantee further rise to 38.2% Fibo located at 1.4525. From the downside, the breach of 1.4300 is capable of failing this intraday rise attempt for today. We prefer that the price remains above 1.4350 to avoid any pressure stemming from the RSI indicator.
- Support: 1.4400-1.4350-1.4300
- Resistance: 1.4450-1.4500-1.4525
Pair’s direction: Upside attempt
Notice: Our trading strategy is revealed for subscribers at the top of this report
The high volatility witnessed by the EUR/USD pair during the Asian session today and the previous session remained limited above 1.0890, where the trading above this level, which represents 38.2% Fibonacci is considered bullish.
However, there are some signs of weakness in the bearish trend as depicted by both RSI and ADX. This means it is important to see a breakout to resistances at 1.0935 and 1.0965 to confirm the upside direction. But for our analysis to be valid, the price must trades above the moving averages, while the breach of 1.0835 is capable of failing this bullish intraday scenario.
Support: 1.0890-1.0835-1.0800
Resistance: 1.0935-1.0965-1.01005
Pair’s direction: Upside attempt
Notice: Our trading strategy is revealed for subscribers at the top of this report


