EUR/USD - European Session
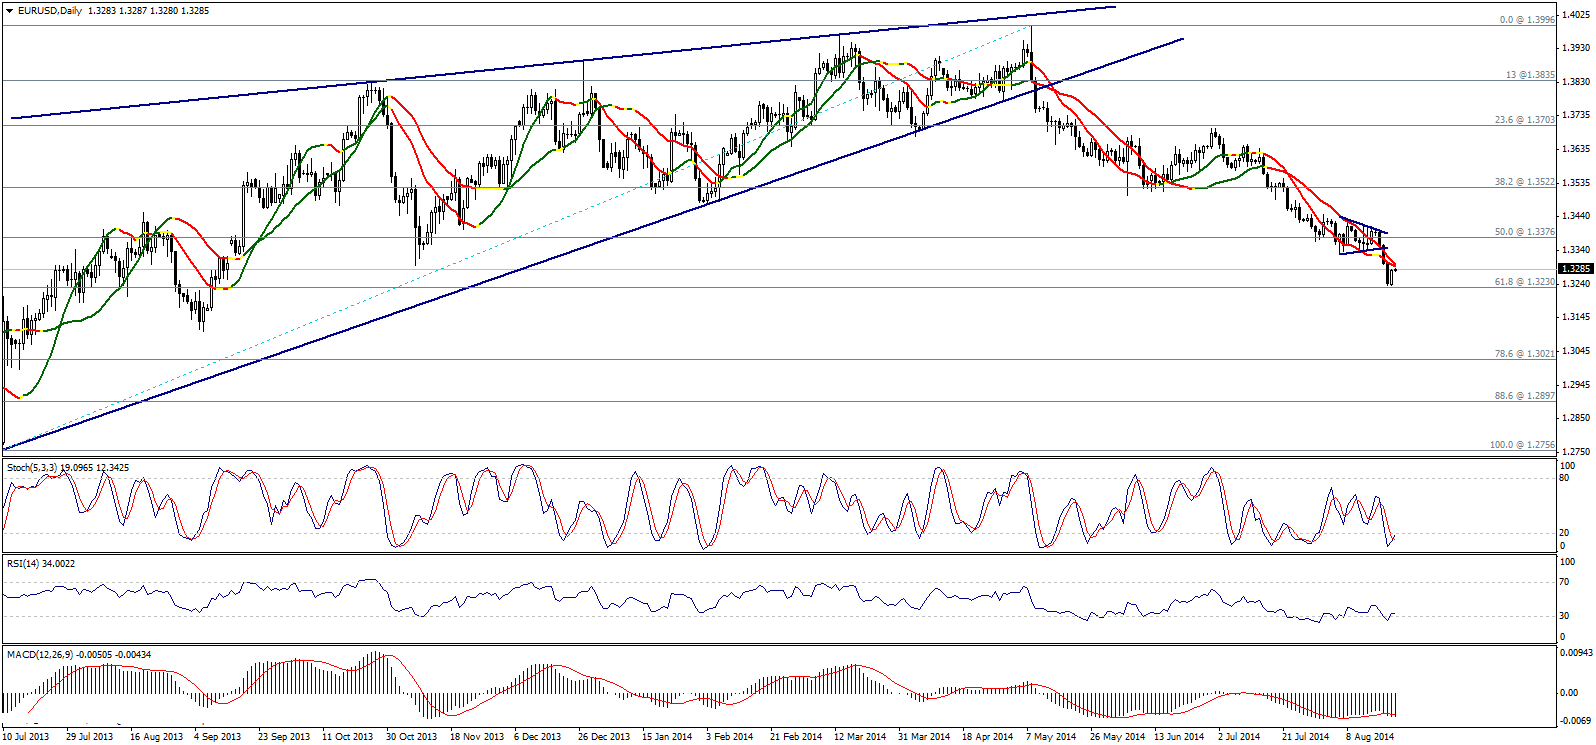
On the above graph, we notice that yesterday's bullish rebound remained limited below Linear Regression Indicators around 1.3300, and trading below the referred to level is negative today. Despite that Risk/Reward Ratios are still inappropriate, we bet today on a downside move and place the stop-loss of our expectations intraday above 1.3320, so the risk is reduced targeting again 1.3230.
From the downside, breaking 1.3230 leads to further bearishness intraday today. Of note, failing to break the support represented in 61.8% correction forces us to close our selling positions.

GBP/USD - European Session
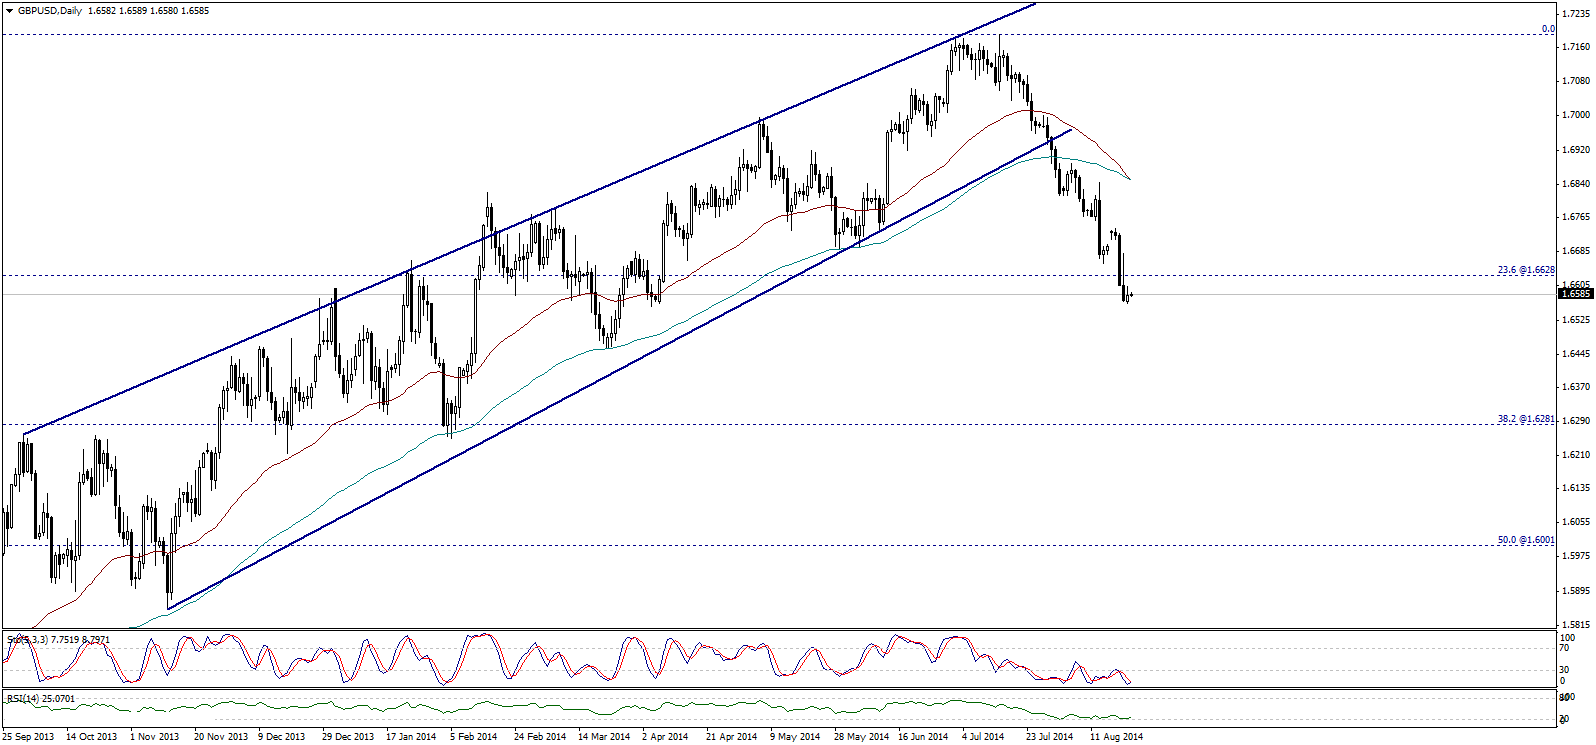
By examening the daily graph, we notice that the pair is stable below 23.6% correction at 1.6630 as trading below it is negative. SMA's met in an attempt to achieve a negative crossover forcing us to ignore the oversold signals showing on momentum indicators.
As long as the pair stabilized below 1.6630, the possibility of further bearishness is available today. But a break below the support 1.6555 is significant to confirm extending the downside move intraday.

USD/JPY - Technical Report
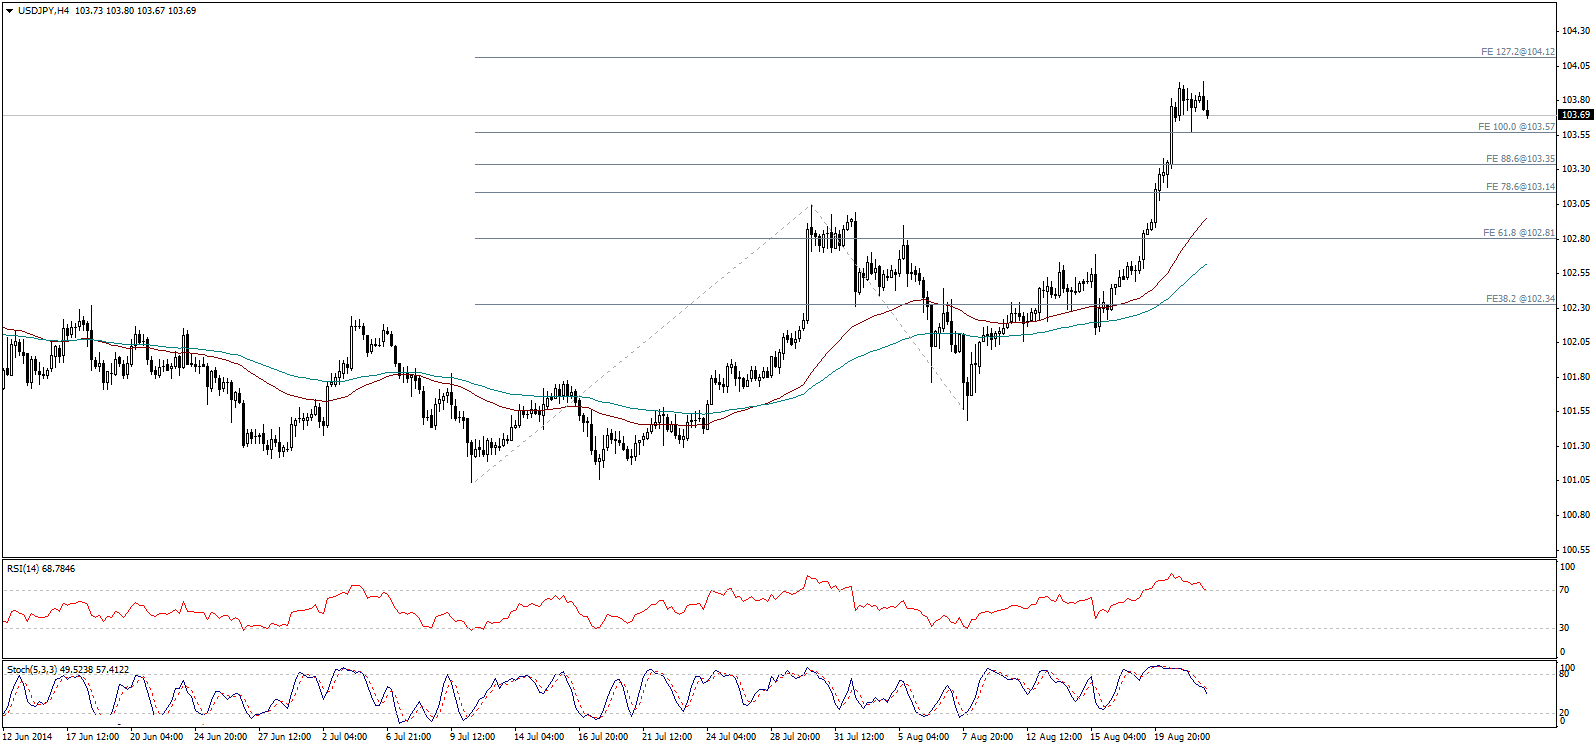
The pair failed to touch the resistance 104.00 - 104.15 then rebounded to the downside but is still limited above 103.55 and other singificant supports. In fact, the pari is showing negative signals represented in momentum indicators.
Our subscribers recieved yesterday a recommendation, and we are forced today to remain neutral to see whether the negative signals will complete to sell the pair next week, or will confirm a new bullish price base.

USD/CHF - Technical Report
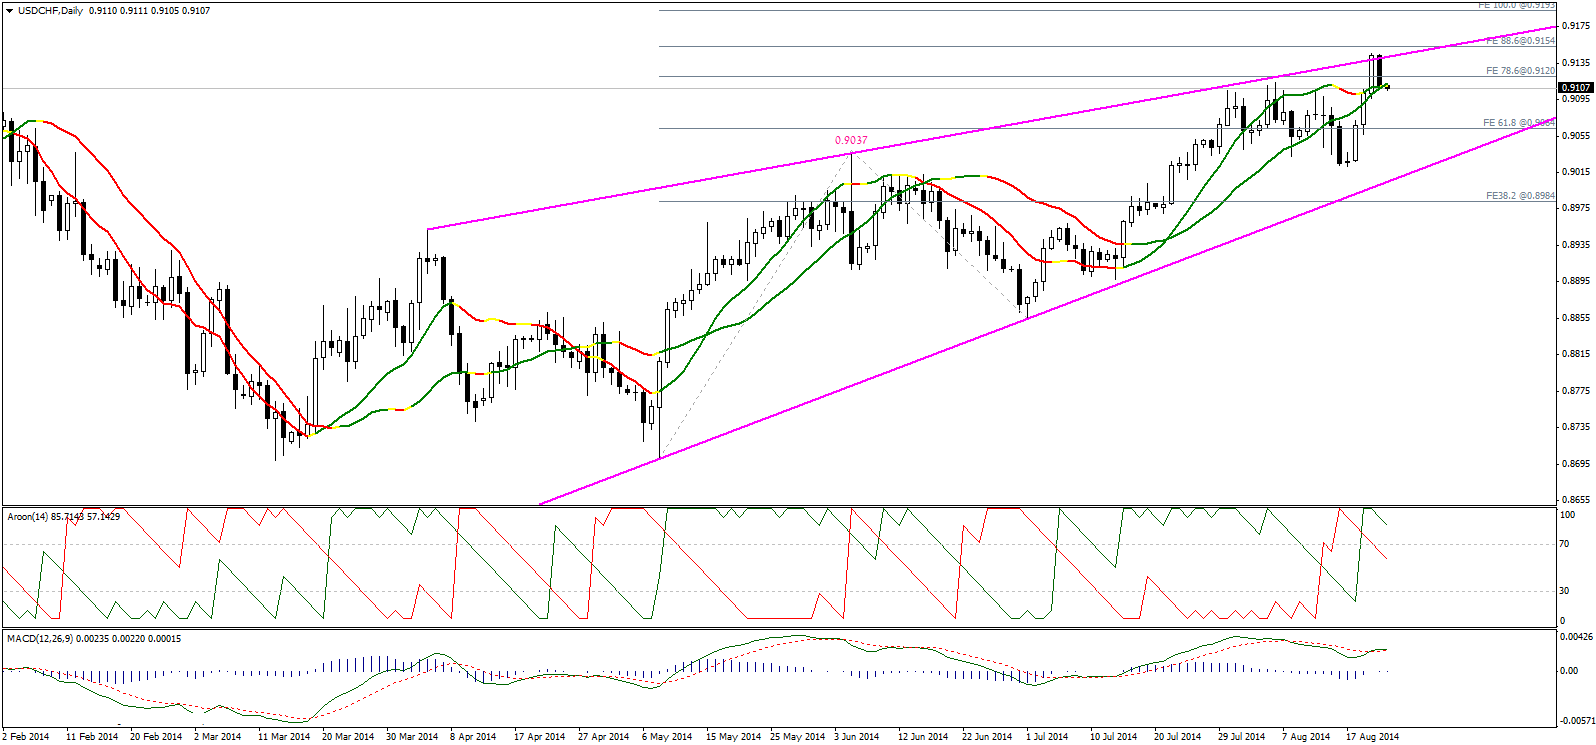
The pair touched levels above 0.9130 before rebounding to the downside. But we should take the bearish rebound into consideration as it started from the key resistance as showing on graph. We will turn to negativity again despite failing intraday in the past two days, and trading below 0.9155 triggers a new bearish correctional wave.
Of note, a break below 0.9060 determines the extend of the downside move today, especially that the technical indicators showing on graph didn't confirm ending positivity yet.

AUD/USD - European Session
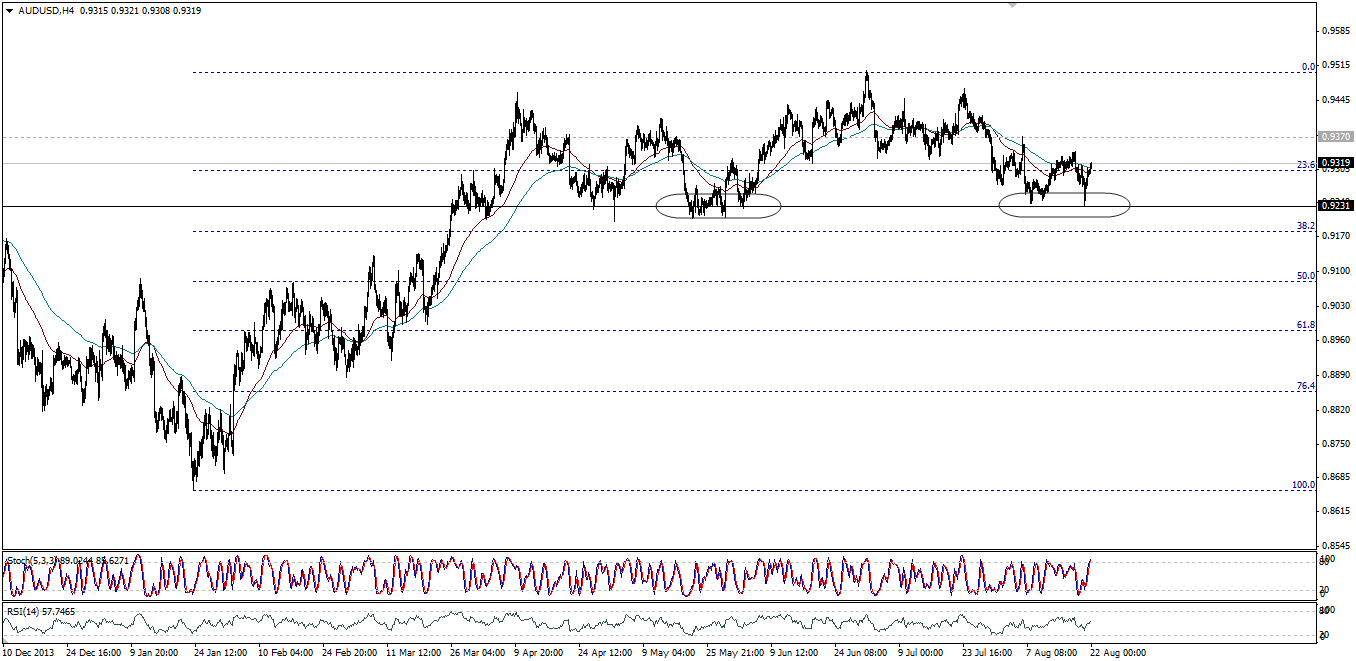
The pair has retraced and is currently trading above 0.9300-0.9310 regions once again. Passing over moving averages and 23.6% Fibonacci retracement level may bring further upside recover, but bulls should clear 0.9340 first where a cluster resistance exits. In result, we will be neutral, while watching out the price behaviors near between 0.9340 and 0.9275 to see whether traders will take the pair towards 0.9400 or 0.9230 once again.

