Get 40% Off
👀 👁 🧿 All eyes on Biogen, up +4,56% after posting earnings. Our AI picked it in March 2024.
Which stocks will surge next?
Unlock AI-picked Stocks

Wednesday's Technical Report: GBP/USD, USD/CHF, USD/JPY, USD/CAD

Published 04/29/2015, 06:04 AM
Updated 07/09/2023, 06:31 AM

GBP/USD - Technical Report
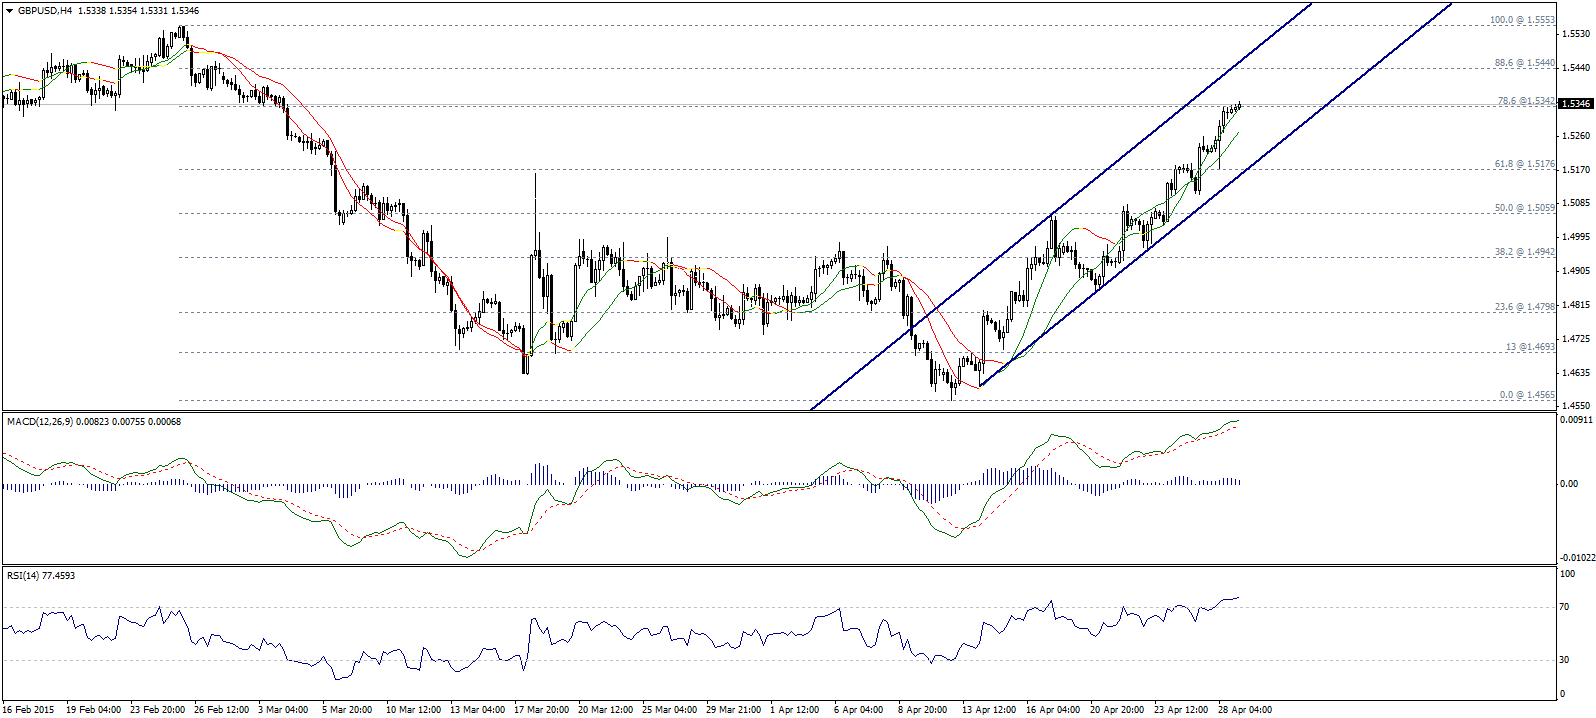
GBP/USD 4-Hour Chart

GBP/USD pair rose to trade just above 78.6% Fibonacci correction located at 1.5340. Trading above the aforesaid level 1.5340 will take the pair higher toward 88.6% Fibonacci presented by 1.5440 level.

Only breaching 1.5235 will cancel our bullish expectations for the intraday trading today.

GBP/USD Support Resistance & Recommendation

USD/CHF - Technical Report

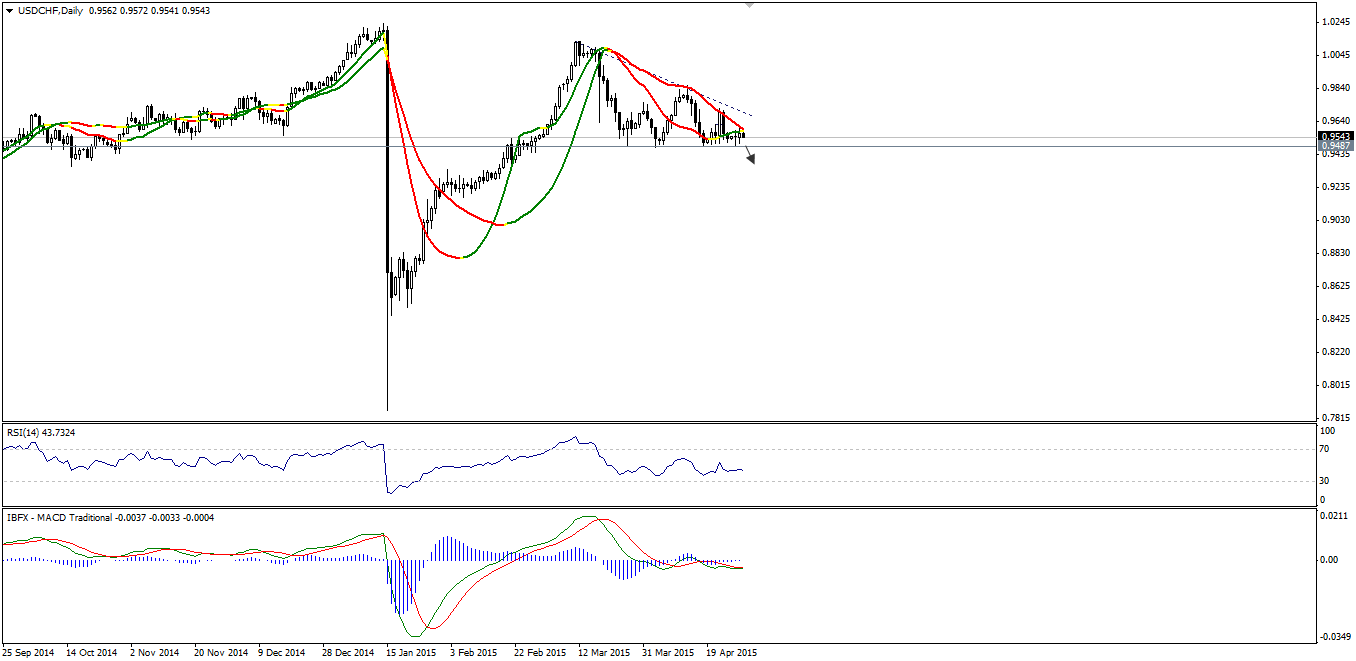
USD/CHF Daily Chart

The USD/CHF pair has been resisted in the areas of upper line for linear regression as seen on the provided daily chart. We still need a breakout below 0.9485 to affirm the bearish tendencies appearing over shorter time-frames.

Anyway, we will be watching the price behaviors until the pair breaches through this aforementioned support to enter the market. On the upside, 0.9620-0.9635 areas represent the floor for potential shorts.

USD/CHF Support Resistance & Recommendation

USD/JPY - Technical Report

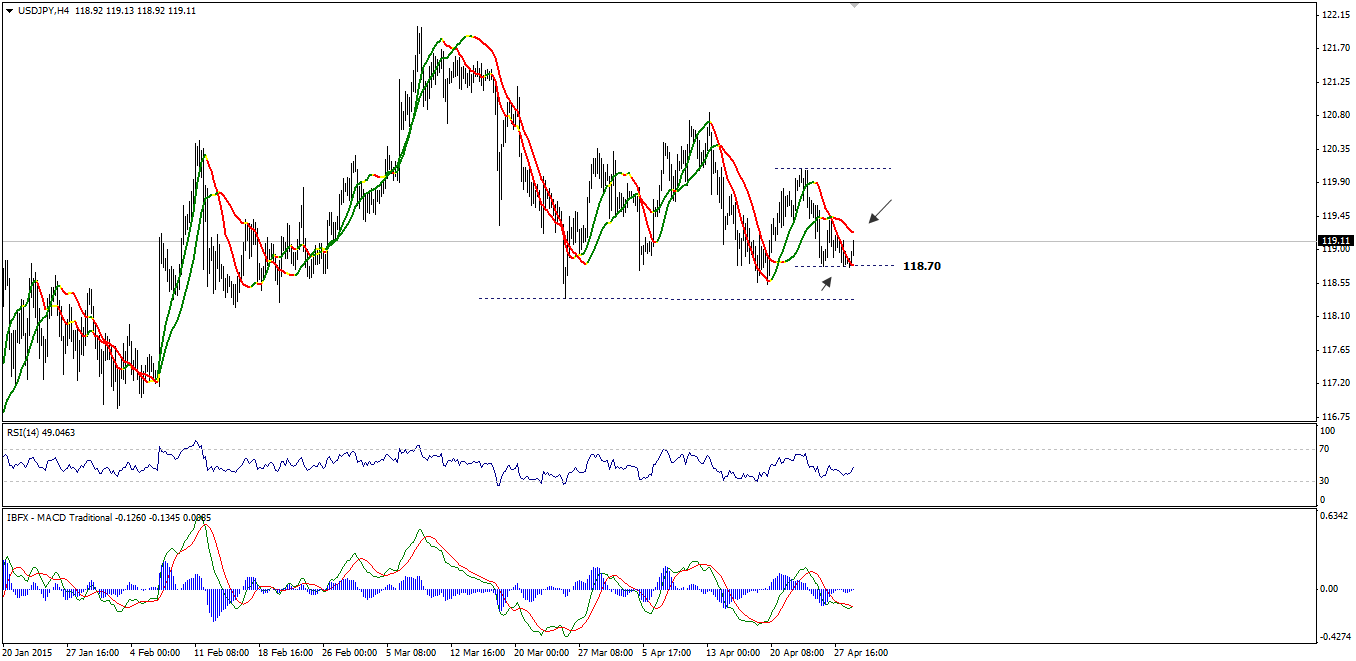
USD/JPY 4-Hour Chart

The USD/JPY pair has been trading within a narrow range, while 118.70 has provided it with support once again. There is a contrarian between technical indicators with MACD and RSI 14 positive and linear regression negative.

We remain on the sideline; noting that, a break below 118.70 will re-new the selling opportunity, while breaching 119.60 will bring buying interests.

USD/JPY Support Resistance & Recommendation

USD/CAD - Technical Report

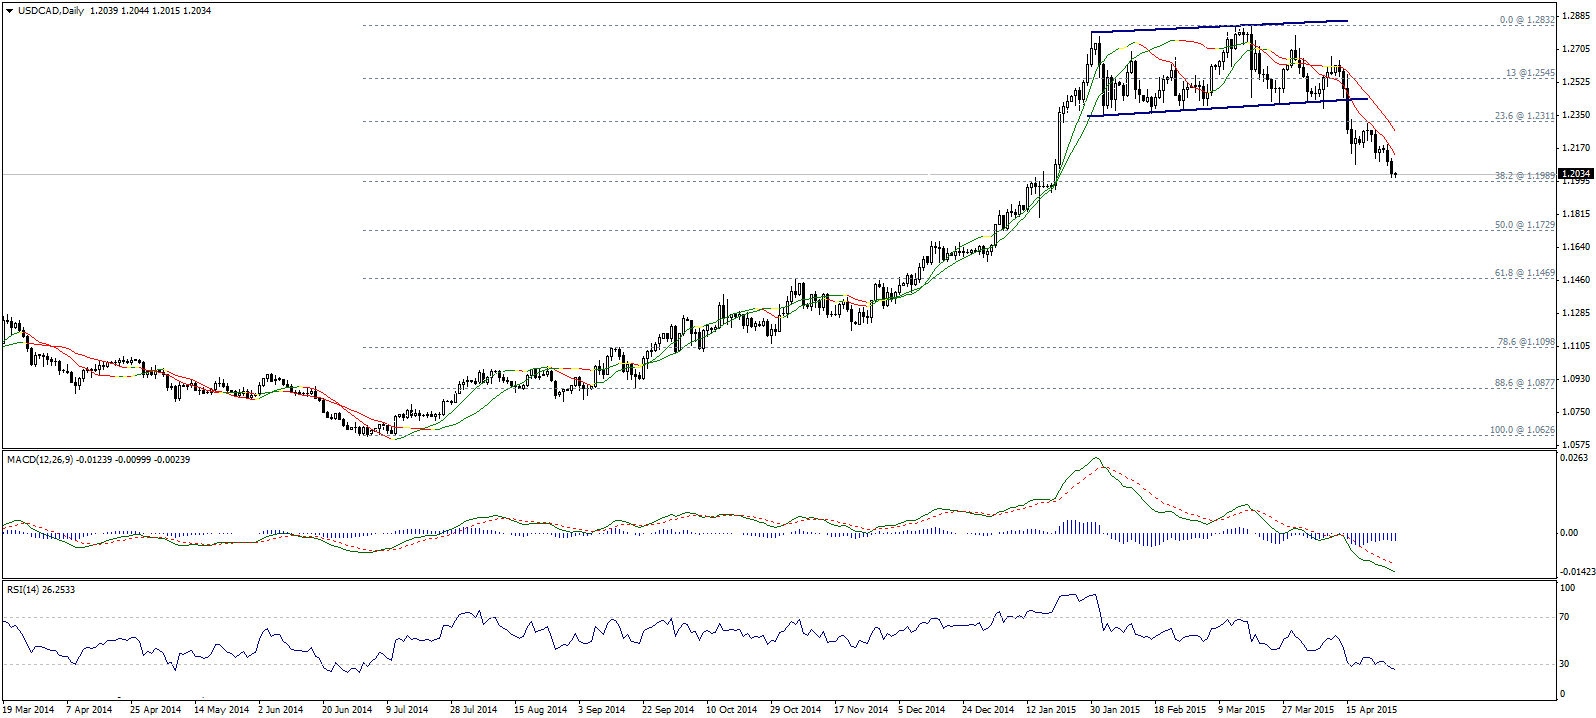
USD/CAD Daily Chart

USD/CAD pair declined approaching our defined technical target at 1.1990 presented by 38.2% Fibonacci correction. Linear regression indicators suggest more bearishness toward that level, however in current trading price, risk/reward ratio is not appropriate for us.

Therefore, we prefer keep our old short positions, but not taking any new positions today until we how the pair will interact with the aforesaid level 1.1990.

3rd party Ad. Not an offer or recommendation by Investing.com. See disclosure here or remove ads .

USD/CAD Support Resistance & Recommendation

AUD/USD - Technical Report

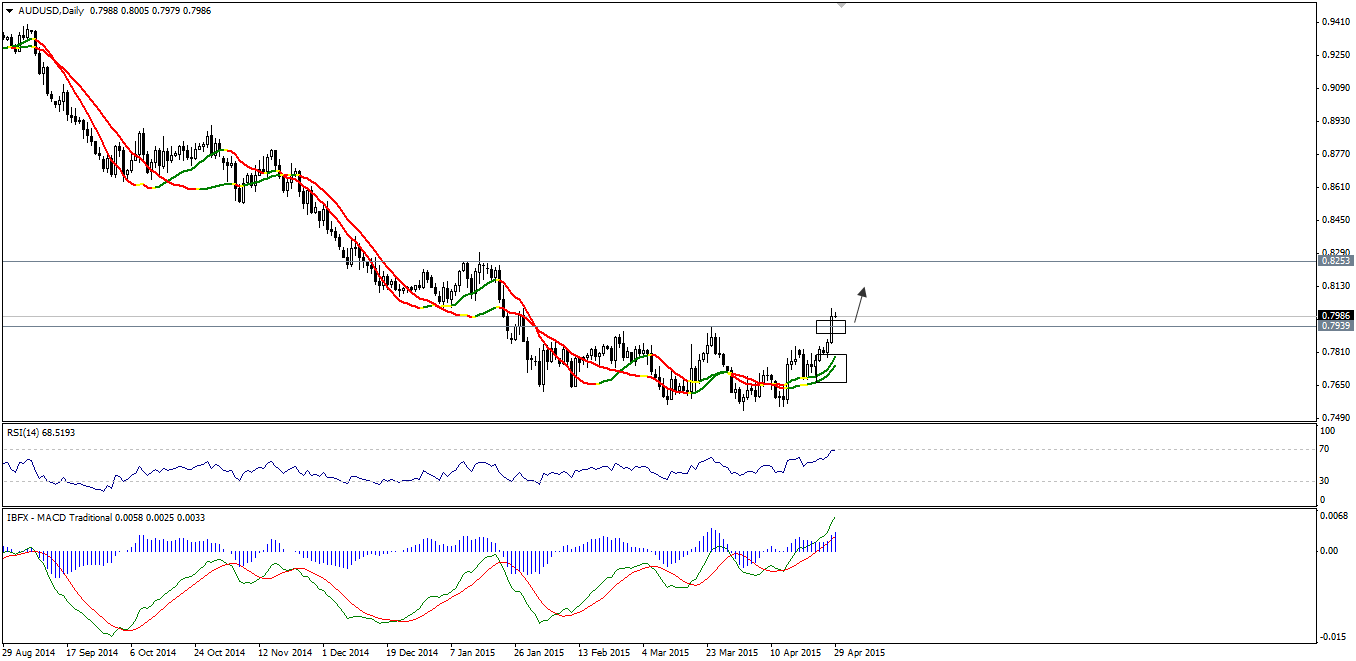
AUD/USD Daily Chart

In accordance with our bullish scenario, the pair has inclined sharply, touching the detected technical objective areas near 0.8030 as seen on the provided daily graph. The daily closing above 0.7940-resistance turned into support- is a positive technical catalyst that may push the pair more to the upside, while the bullish actions are supported by the positivity on technical indicators.

Eyes are now on 0.8025 as a break above it will ease the path towards 0.8125 boundaries.

AUD/USD Support Resistance & Recommendation

NZD/USD - Technical Report

NZD/USD Daily Chart

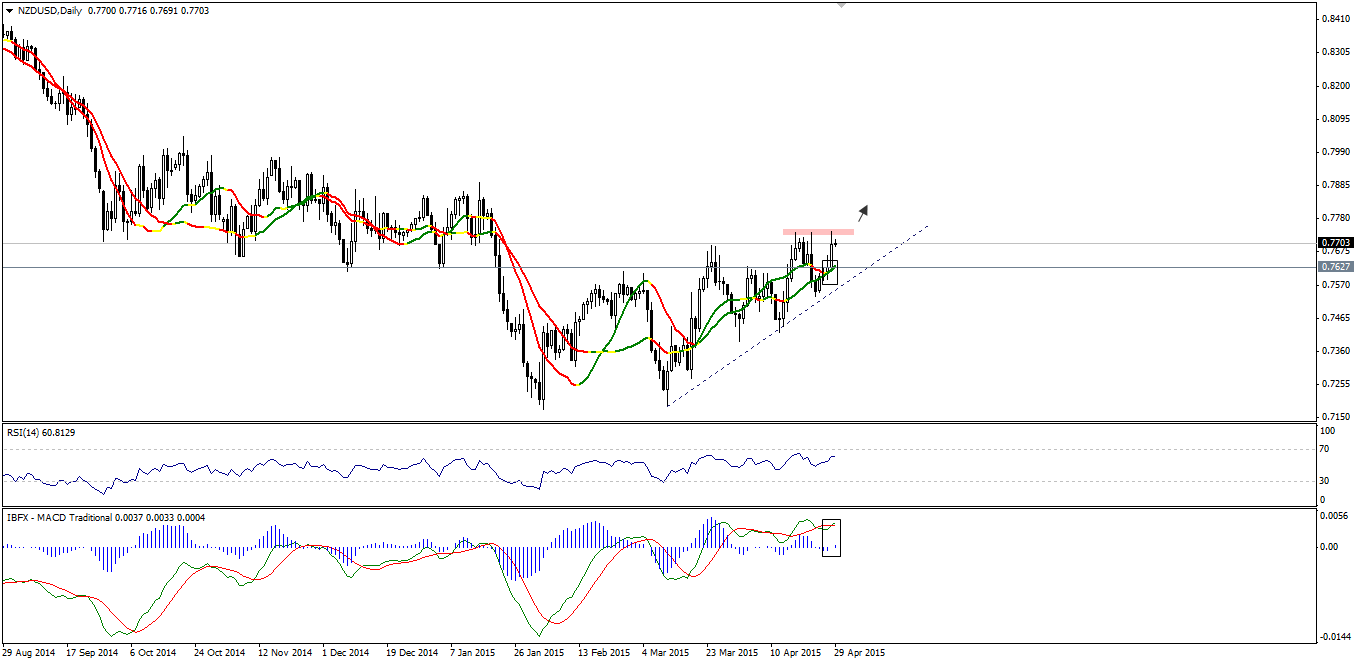
Respecting our yesterday’s proposed bullish scenario, the NZD/USD pair has soared reading detected technical objective zones at 0.7740 as seen on the provided daily chart.

Technical indicators turned into positivity and that may trigger more buying interests over intraday basis and a break above 0.7740 will accelerate the bullishness. On the downside, coming below 0.7625 will negate.

NZD/USD Support Resistance & Recommendation

Latest comments

Risk Disclosure: Trading in financial instruments and/or cryptocurrencies involves high risks including the risk of losing some, or all, of your investment amount, and may not be suitable for all investors. Prices of cryptocurrencies are extremely volatile and may be affected by external factors such as financial, regulatory or political events. Trading on margin increases the financial risks.
Before deciding to trade in financial instrument or cryptocurrencies you should be fully informed of the risks and costs associated with trading the financial markets, carefully consider your investment objectives, level of experience, and risk appetite, and seek professional advice where needed.
Fusion Media would like to remind you that the data contained in this website is not necessarily real-time nor accurate. The data and prices on the website are not necessarily provided by any market or exchange, but may be provided by market makers, and so prices may not be accurate and may differ from the actual price at any given market, meaning prices are indicative and not appropriate for trading purposes. Fusion Media and any provider of the data contained in this website will not accept liability for any loss or damage as a result of your trading, or your reliance on the information contained within this website.
It is prohibited to use, store, reproduce, display, modify, transmit or distribute the data contained in this website without the explicit prior written permission of Fusion Media and/or the data provider. All intellectual property rights are reserved by the providers and/or the exchange providing the data contained in this website.
Fusion Media may be compensated by the advertisers that appear on the website, based on your interaction with the advertisements or advertisers.
© 2007-2024 - Fusion Media Limited. All Rights Reserved.