EUR/USD - Technical Report
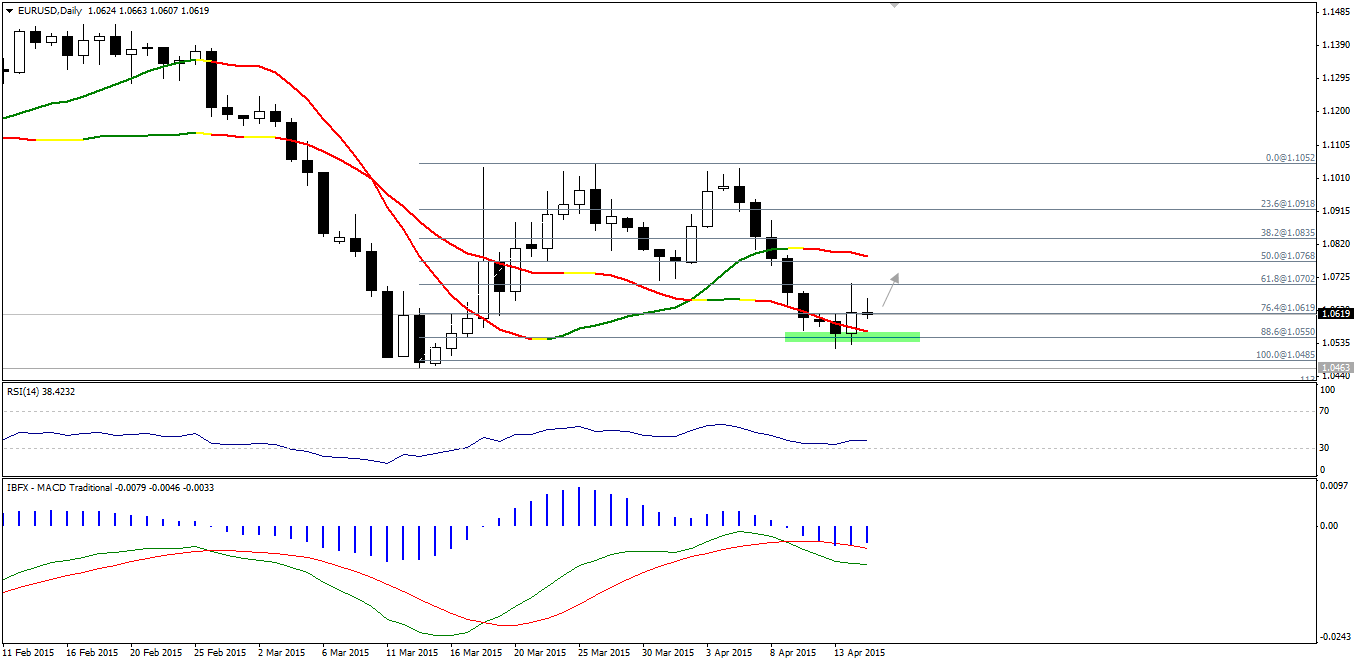
Fluctuation remains very strong on the pair, as prices have soared yesterday towards 61.8% Fibonacci as seen on the provided daily chart; however, the pair has moved strongly downwards from there. Anyway, we will depend on the solidity of 1.0520 support to suggest potential upside move attempt today aiming to clear 1.0700 regions. A break below 1.0520 will negate the bullish recovery.

GBP/USD - Technical Report
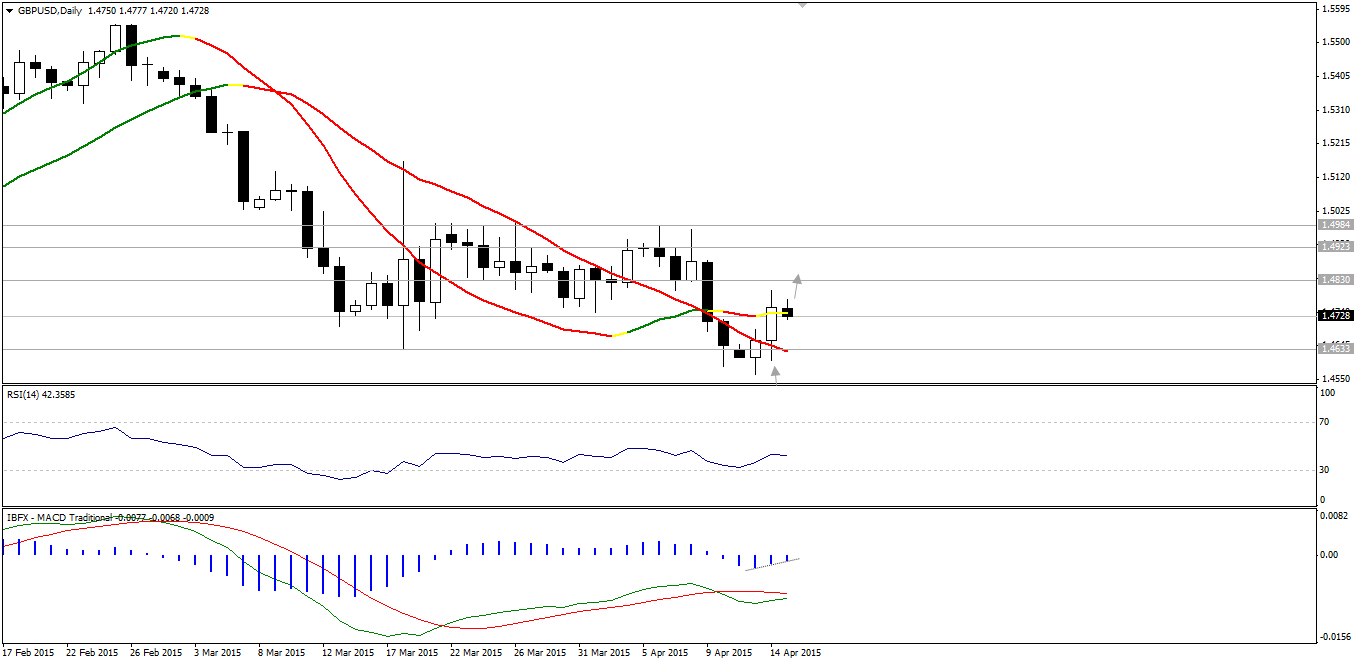
The GBP/USD has moved strongly to the upside and is currently trading 30 pips above our yesterday’s suggested entry point. Although it didn’t hit stop loss, but the sharp inclines force us to close any shorts and reverse after forming a long white candlestick pattern. On the downside, 1.4630 should protect today’s bullish expectations.

USD/JPY - Technical Report
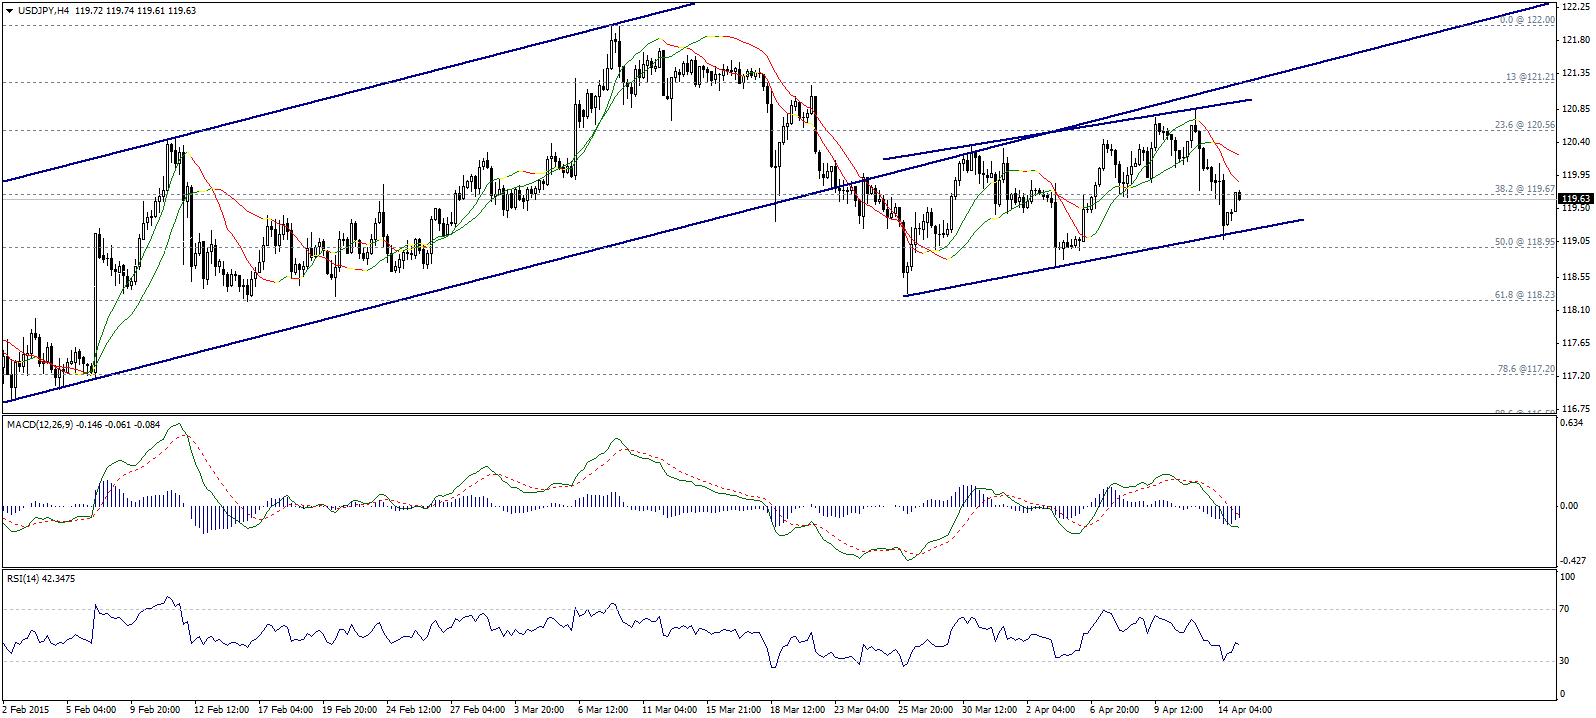
The USD/JPY pair dropped yesterday approaching 50% Fibonacci correction at 118.95, however, a new minor up channel confirmed. Therefore, we need to see the pair breach 118.95 level to confirm more bearishness toward 61.8% Fibonacci level at 118.25.
Linear regression indicators are negative, moreover, MACD signal lines trading below the zero line; thus, more bearishness is expected. We should not exclude upside correction attempts, but we will consider any trading below 120.55 negative.

USD/CHF - Technical Report
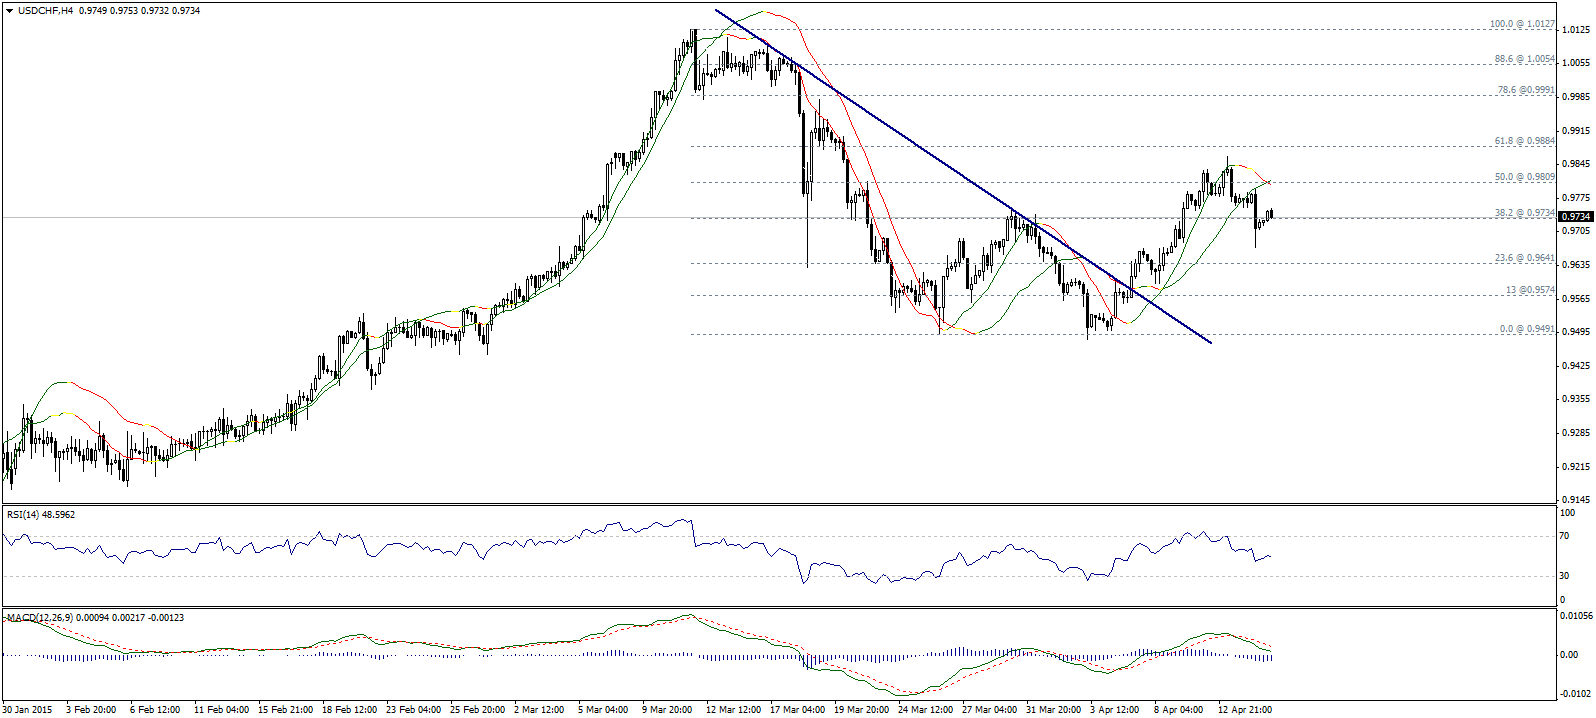
The USD/CHF pair dropped yesterday before rising to trade around 38.2% Fibonacci correction located at 0.9735. More negative signs appears, as linear regression indicators crossed negatively and MACD signal lines approaching the zero line. Therefore, we expect another down wave today.
Trading below 0.9820 is needed to keep the bearishness valid today.

USD/CAD - Technical Report
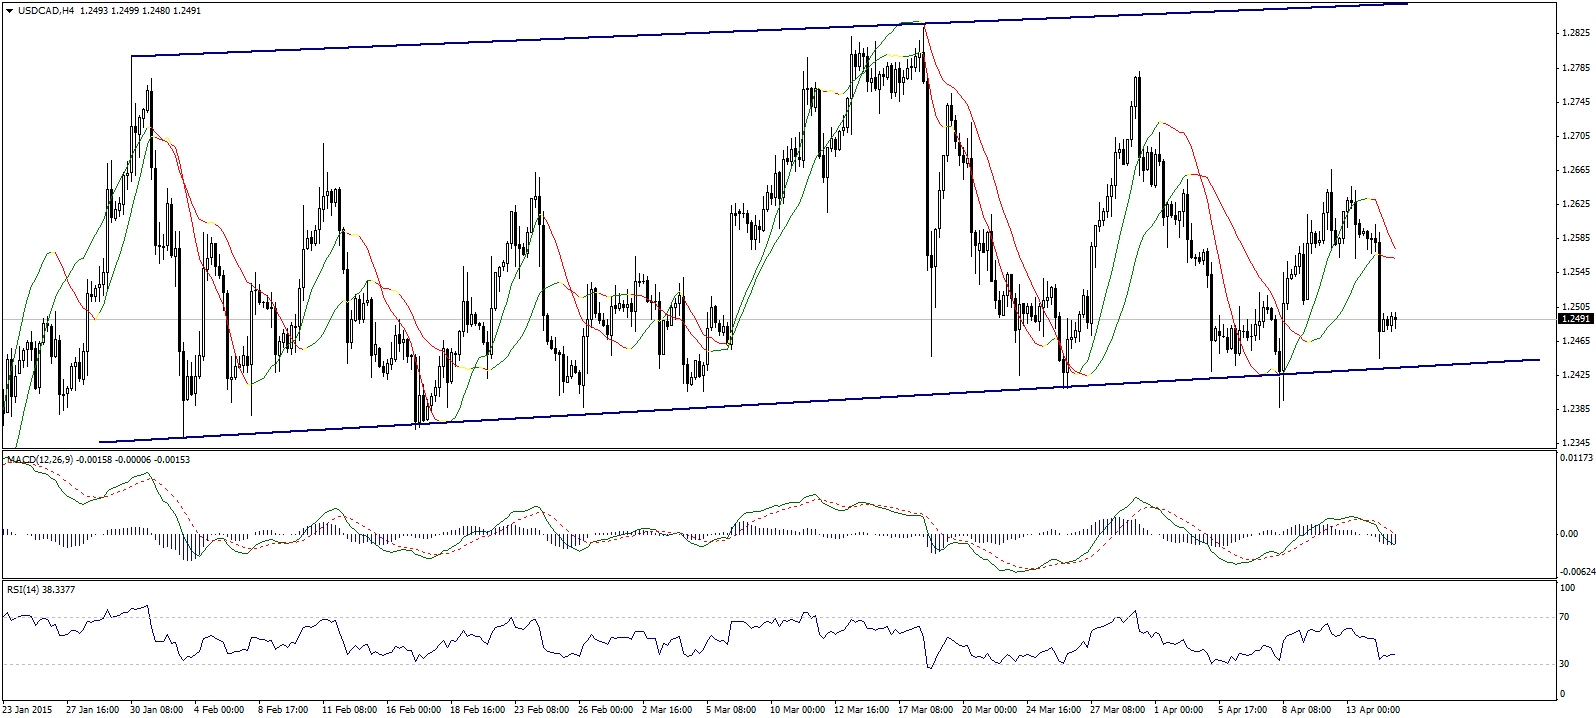
USD/CAD pair dropped as expected, and bearishness continues as linear regression indicators are approaching to achieve bearish crossover and MACD indicator is negative. However, breaching 1.2400 is needed now to confirm bearishness today.
We prefer staying aside today, as the pair approaching the main sideways support at 1.2400. We will update this report for registered users if any new signal appeared.

AUD/USD - Technical Report
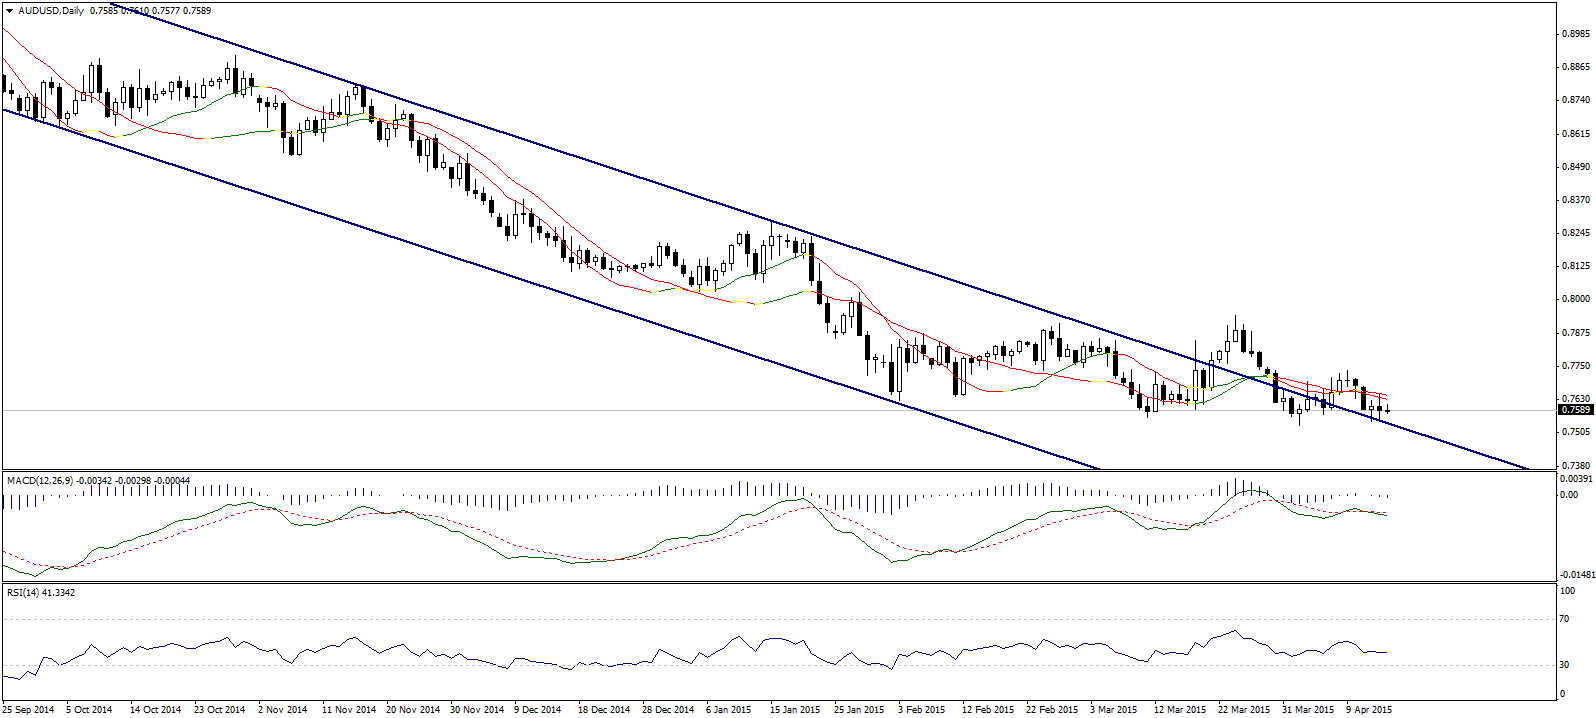
The AUD/USD pair is trading within a tight range below linear regression indicators, on the other hand, the pair is trading above the main resistance of the down trend. RSI14 indicator is trading sideways direction, and that makes us prefer staying aside waiting for more confirmations.
Breaching up 0.7735 is needed to confirm bullishness return, while breaching down 0.7525 may signal another bearish wave.

NZD/USD - Technical Report
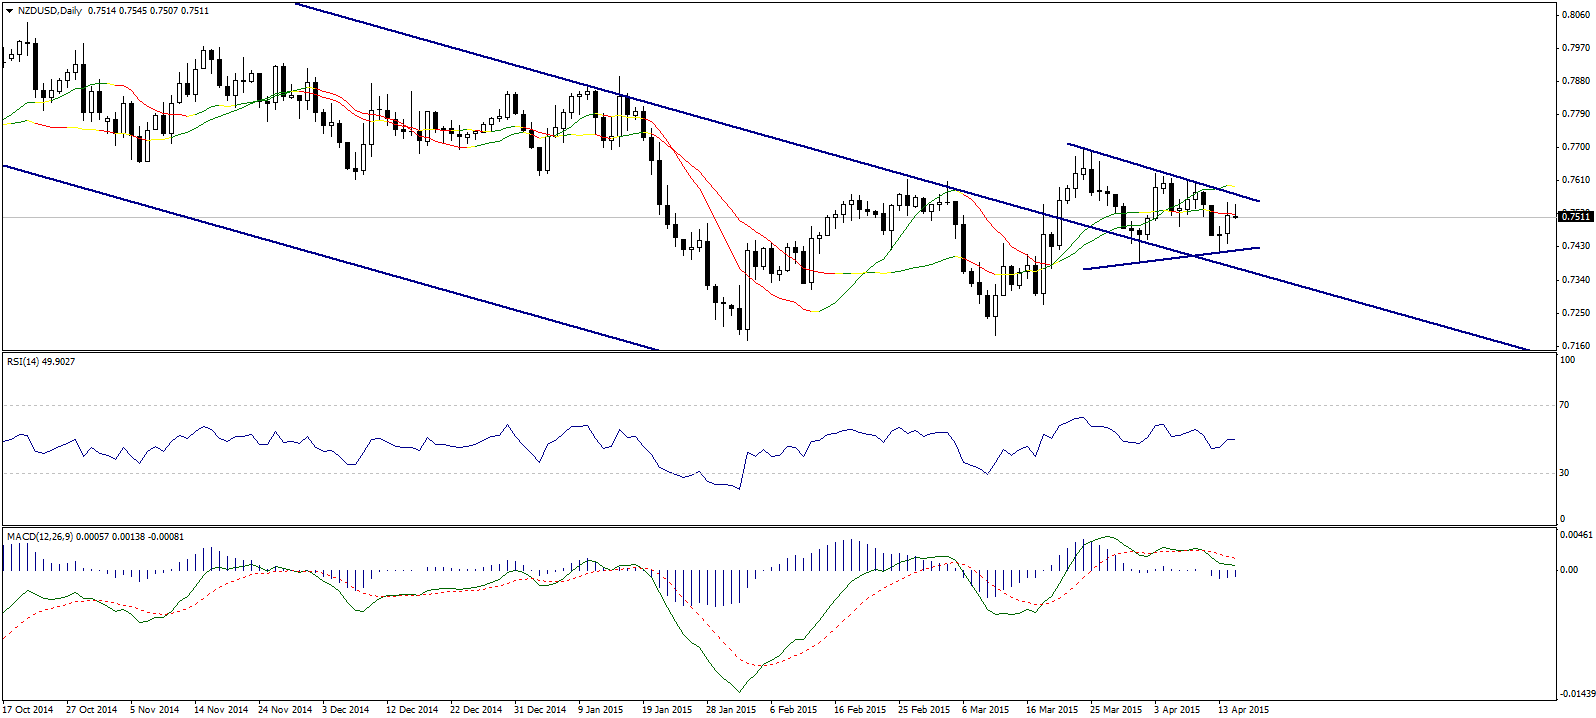
The NZD/USD trading below linear regression indicators inside a sideways triangle. Current trading between 0.7420 and 0.7575 makes us prefer staying aside, as the pair may be making a new solid aria to rise after achieved breaching up the main resistance of the down trend channel.
On the other hand, breaching down 0.7385 would signal bullishness failure and cause another down wave.

