EUR/USD - Technical Report
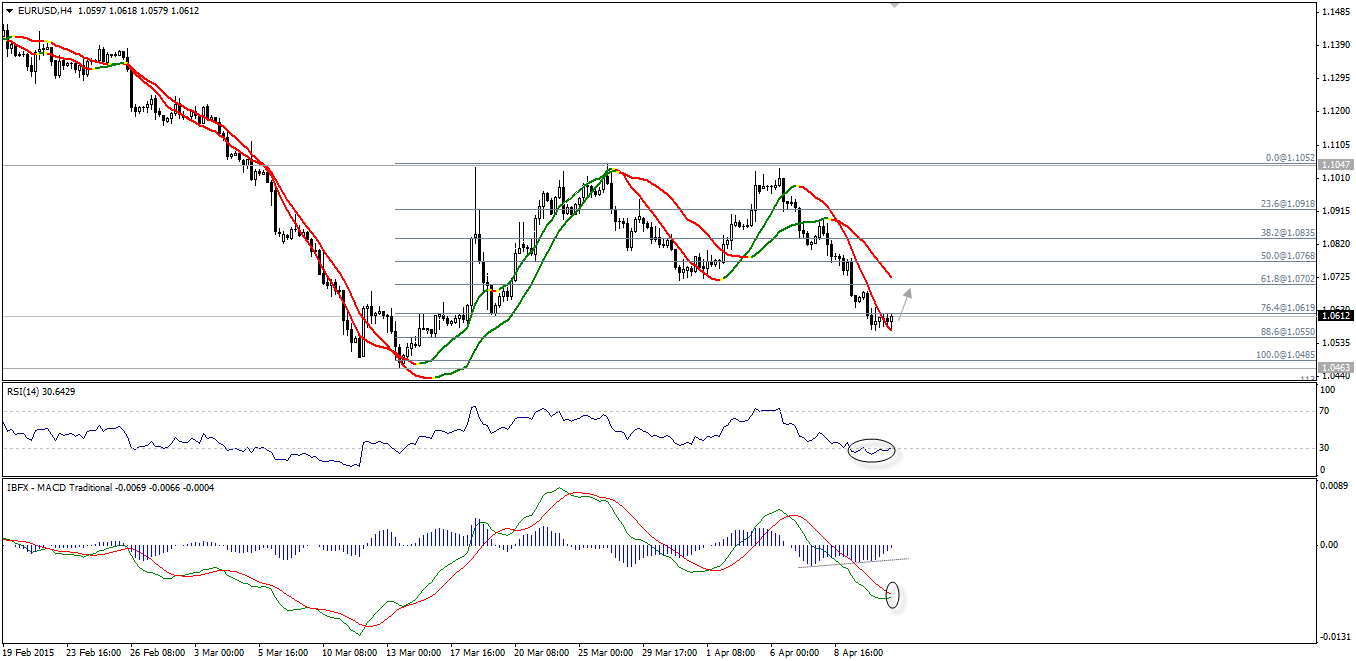
In line with our previous technical comment for the EUR/USD pair, prices have plummeted below 1.0700 regions approaching one our targets at 1.0550. Areas of 1.0550 act as a minor Fibonacci level as seen on the provided graph, while MACD and RSI14 started to show signs of consolidation. Therefore, we may witness mild upside actions over upcoming sessions mainly targeting the broken support-turned into resistance- at 1.0700. Any long positions should be protected by 1.0500.

GBP/USD - Technical Report
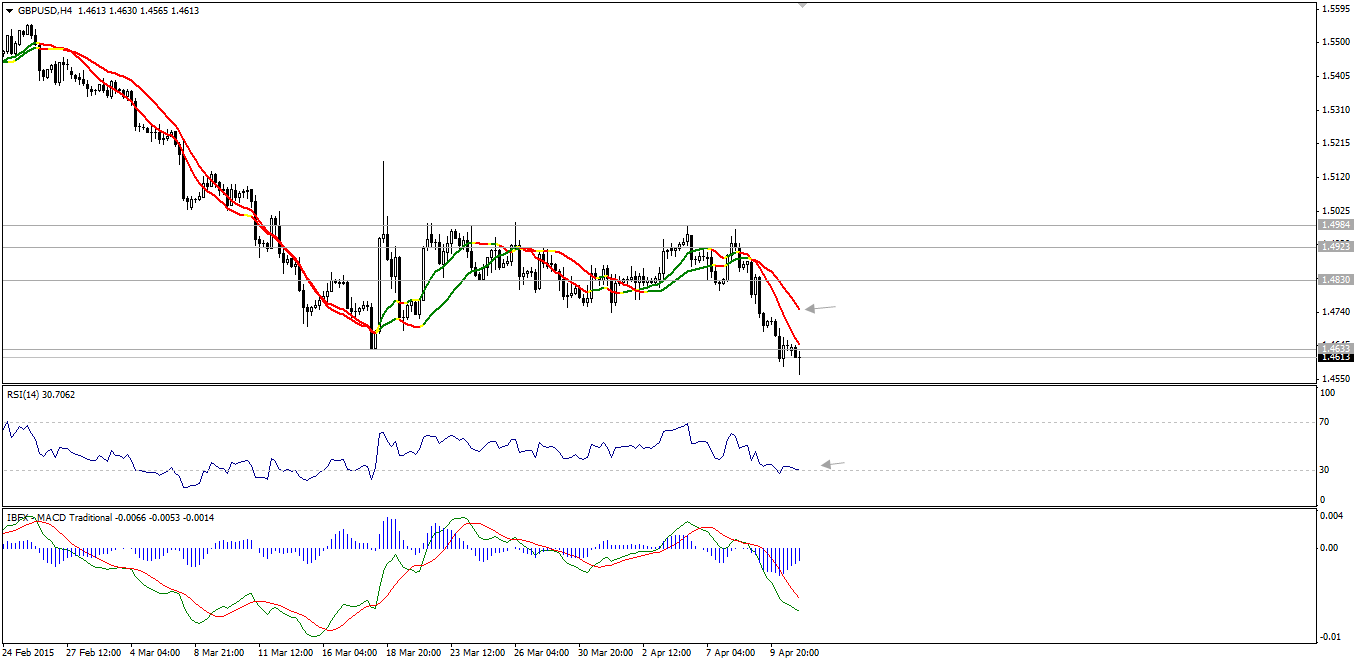
The pair has collapsed below our previous suggested targets at 1.4640 where it tested the 1.4550 regions as seen on the provided chart. Currently, we see signs of drawing a long lower shadow, while oversold sign on RSI could help the pair to achieve some kind of recovery. However, stability below linear regression is a negative catalyst. This contrarian between signs forces us to stand aside awaiting for confirmation.

USD/JPY - Technical Report
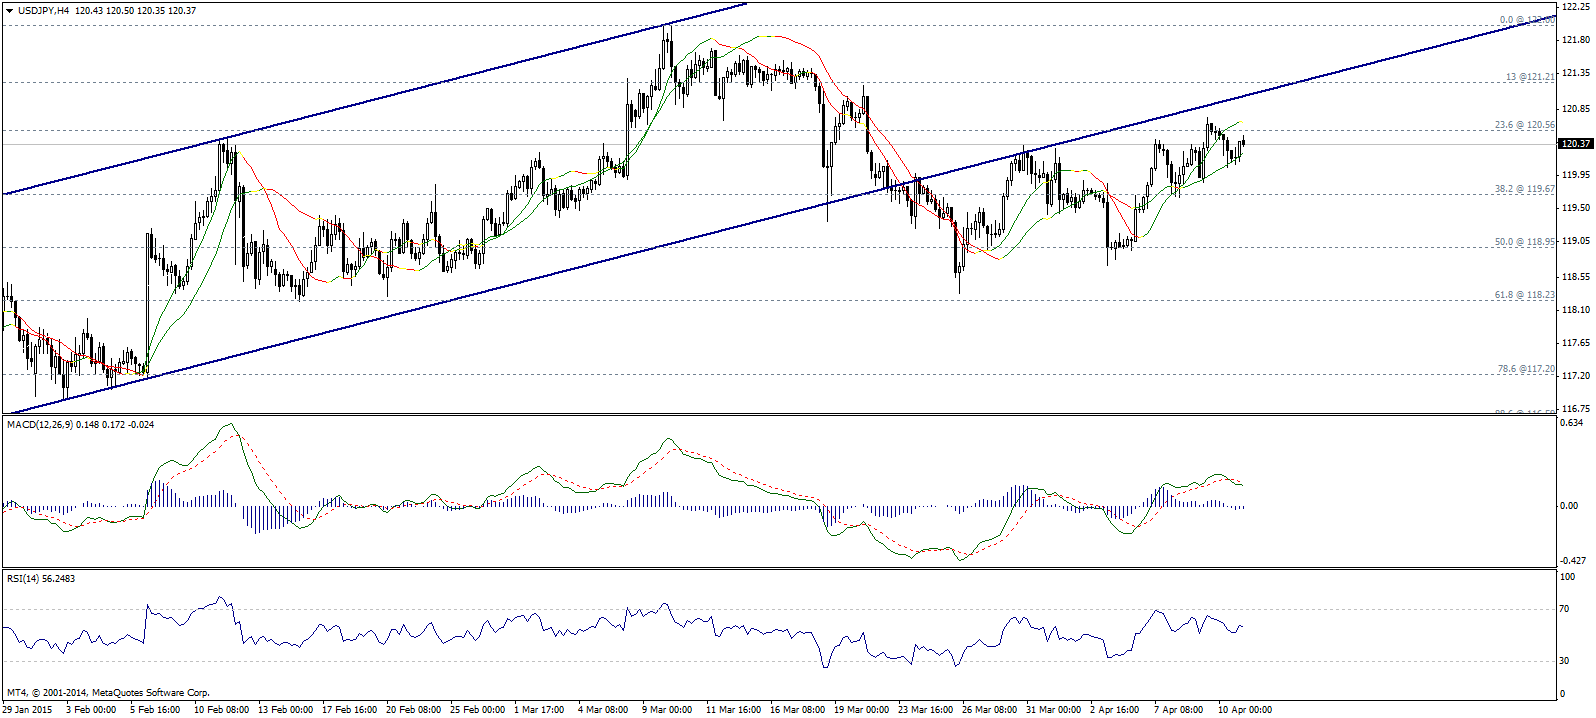
The USD/JPY pair could not stay above 120.55 Fibonacci 23.6% resistance level. Trading below 120.55 could force the pair to decline again. However, breaching down 119.65 is needed to confirm bearishness.
MACD indicator showing some kind of weakness, while trading below 34 linear regression indicator allow us to short the pair. Breaching up 121.20 during this week will cancel any bearish expectation, while breaching down 119.65 will confirm it.

USD/CHF - Technical Report
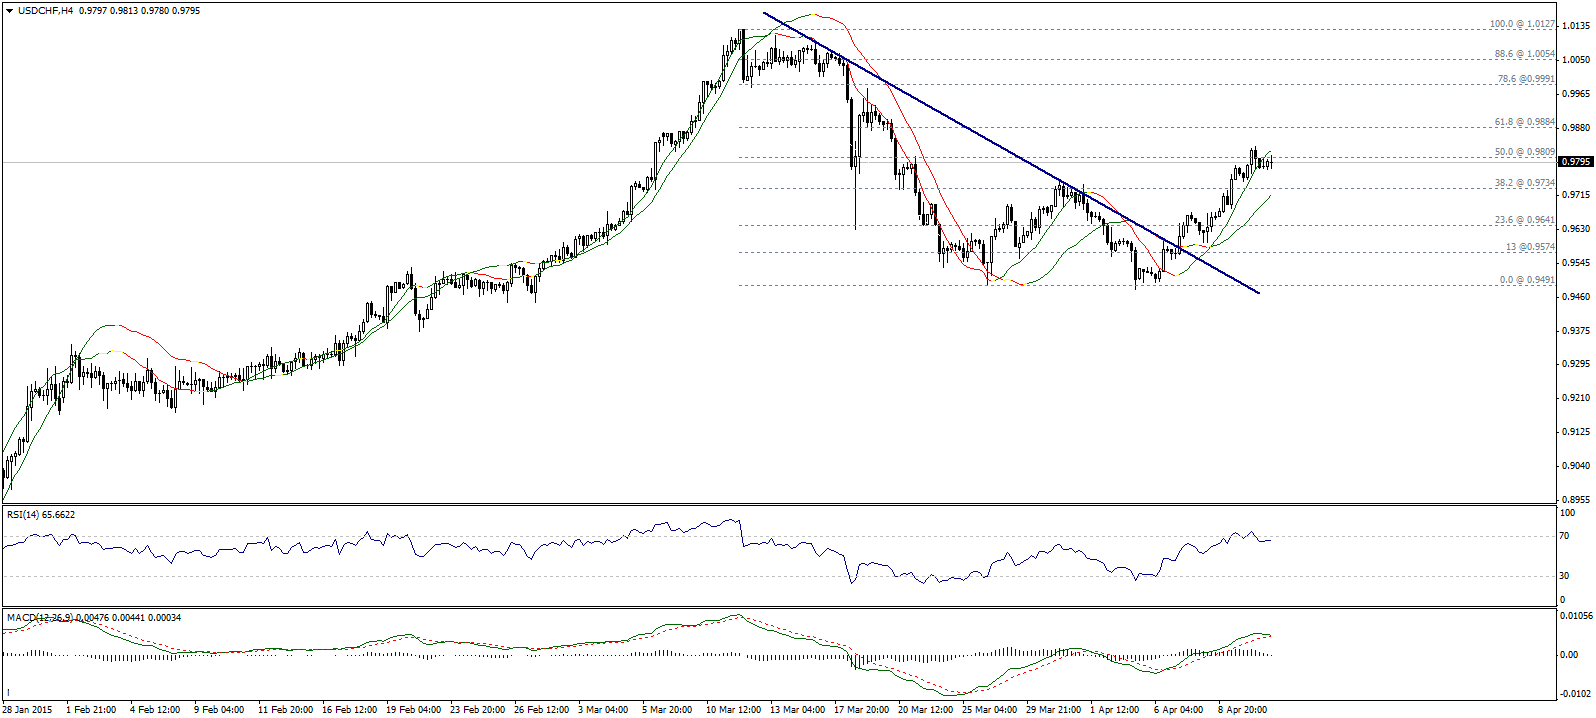
The USD/CHF pair is facing 50% Fibonacci level, on the other hand, MACD and RSI14 indicators shows weakening of the bullishness. Trading below linear regression indicator 34 another bearish factor, however we cannot go to the bearish side before breaching down 0.9735.From the upside, breaching 0.9820 could bring another bullish wave.
According to the technical facts, we prefer staying aside awaiting for more confirmation.

USD/CAD - Technical Report
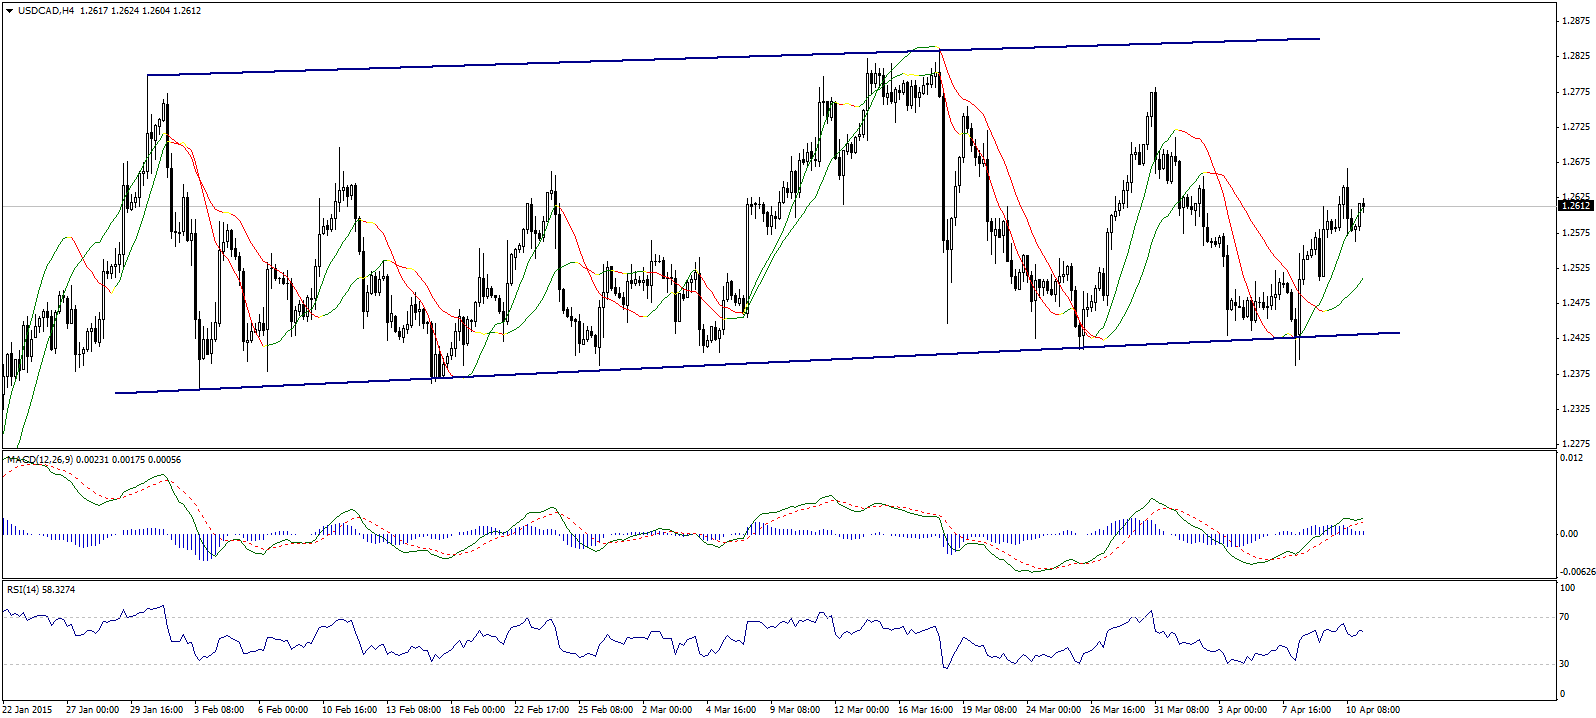
Although The USD/CAD pair dropped during last Fridays trading, the pair is still trading within a bullish arias. MACD indicator still positive, and linear regression indicators are positively trading too.
On the other hand, breaching up 1.2645 is needed to confirm bullishness and cancel the negative candle sticks structure appearing on the 4H chart. Therefore, we will wait breaching 1.2645 before taking any long positions.

AUD/USD - Technical Report
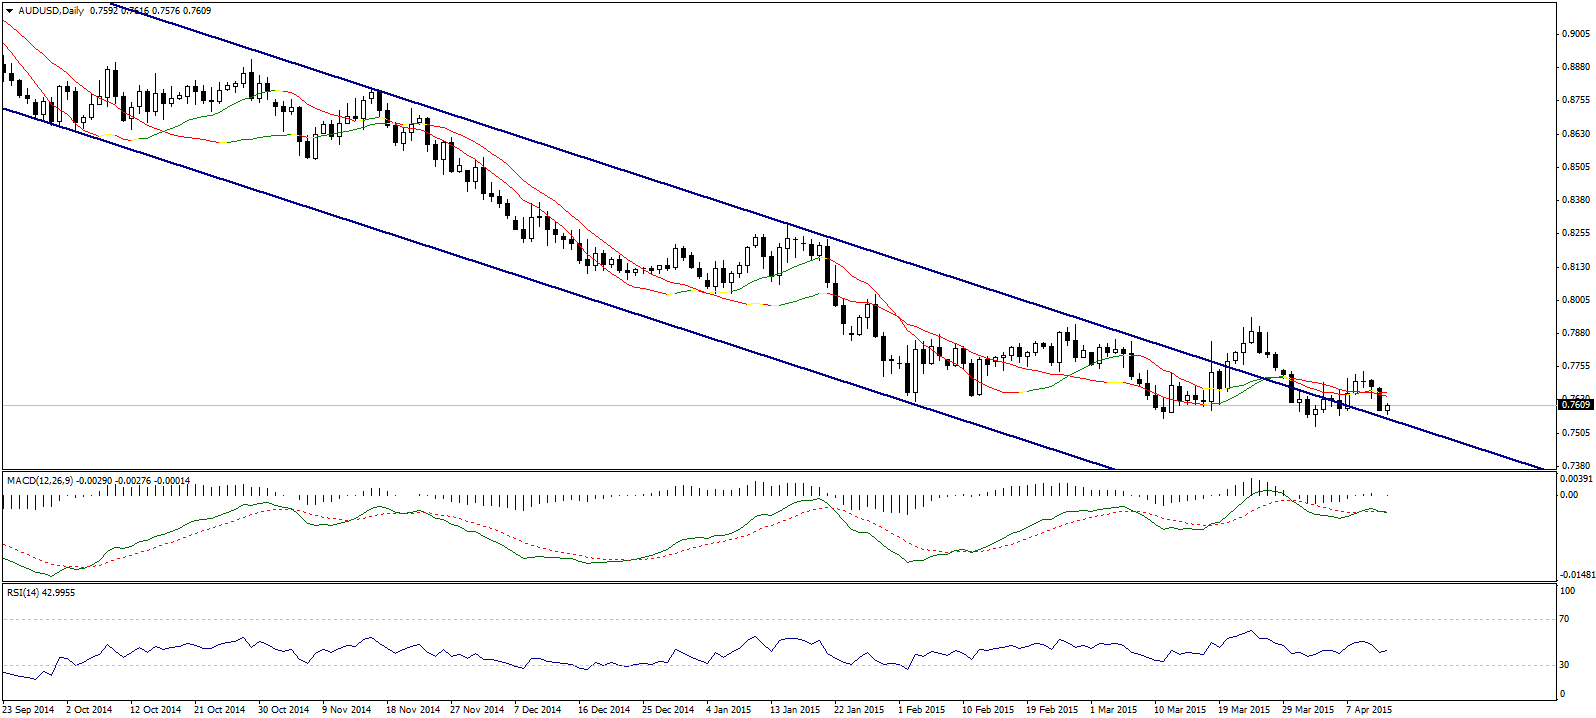
The AUD/USD pair dropped, however, the pair is still trading above the main resistance of the down trend as we can see on the image above. Trading above 0.7525 considered positive, on the other hand, breaching up 0.7735 is needed to confirm the bullishness.
Therefore, as the pair is trading between 0.7735 and 0.7525, we prefer staying aside.

NZD/USD - Technical Report
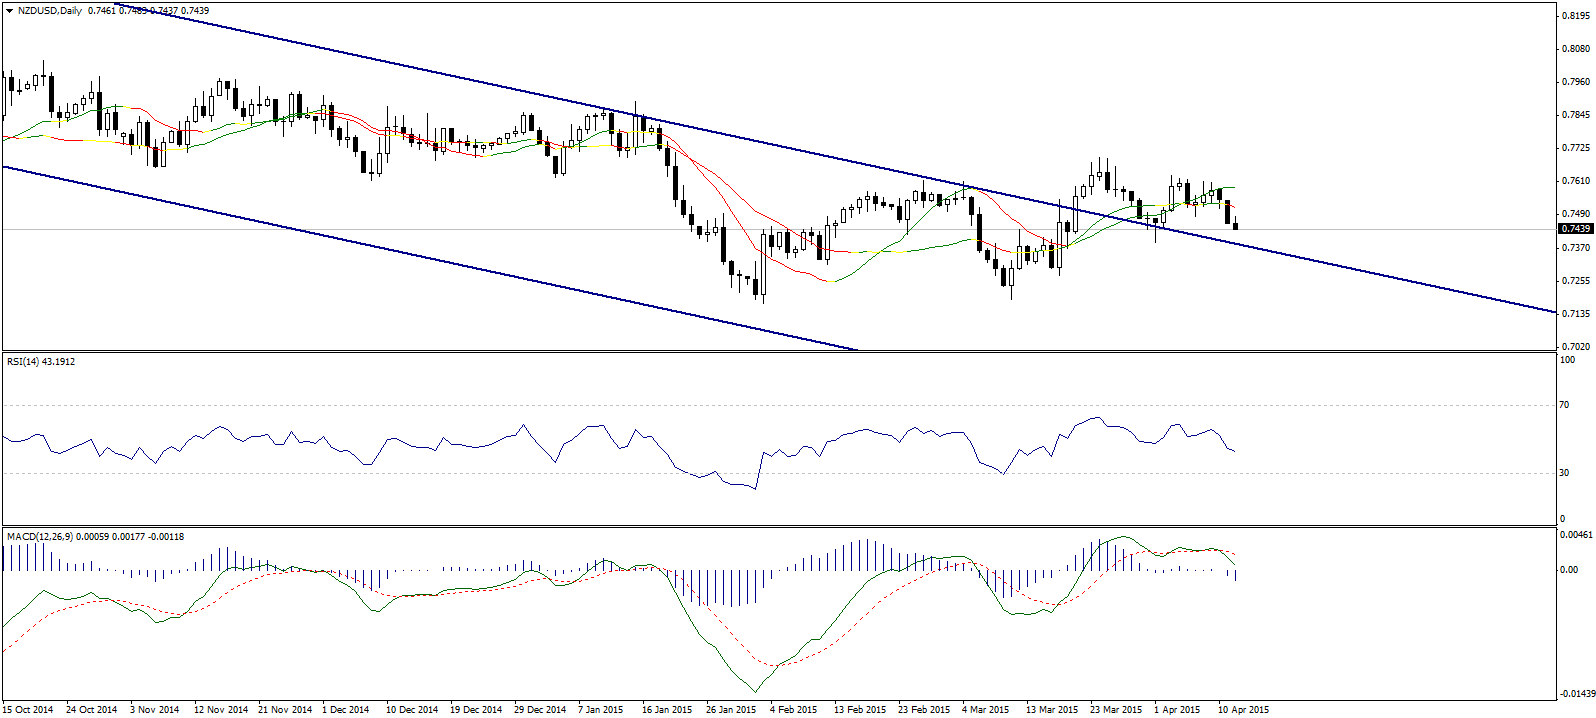
The NZD/USD pair entered a sideways range between 0.7600 and 0.7365. Trading between the aforesaid levels makes us prefer staying aside. Though, many negative signs appears on indicators, and that may force the pair to decline. Therefore, we will put a short order below 0.7365, otherwise, we will stay neutral.

