Get 40% Off
💰 Buffett reveals a $6.7B stake in Chubb. Copy the full portfolio for FREE with InvestingPro’s Stock Ideas toolCopy Portfolios

Tuesday's Technical Report: GBP/USD Trapped Within Tight Range

Published 04/07/2015, 06:43 AM
Updated 07/09/2023, 06:31 AM
GBP/USD
-
USD/JPY
-
USD/CHF
-
AUD/USD
-
USD/CAD
-
NZD/USD
-

GBP/USD - Technical Report
GBP/USD Daily Chart

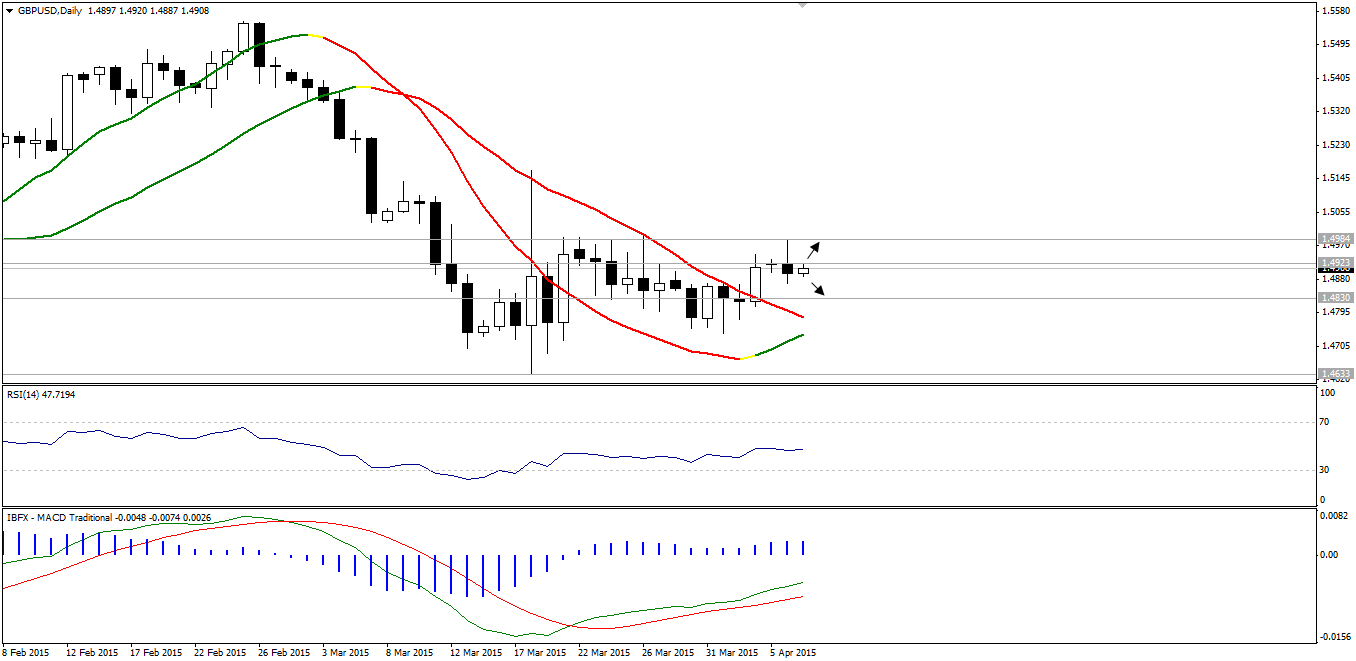
The GBP/USD has been trapped within a tight range after being resisted at 1.4985 once again. MACD and RSI14 remains neutral forcing us to stand aside, as risk versus reward ratio remain high. A break above 1.4985 is positive, while coming beneath 1.4870 is negative for intraday traders.

GBP/USD Support Resistance & Recommendation

USD/JPY - Technical Report

USD/JPY 4-Hour Chart

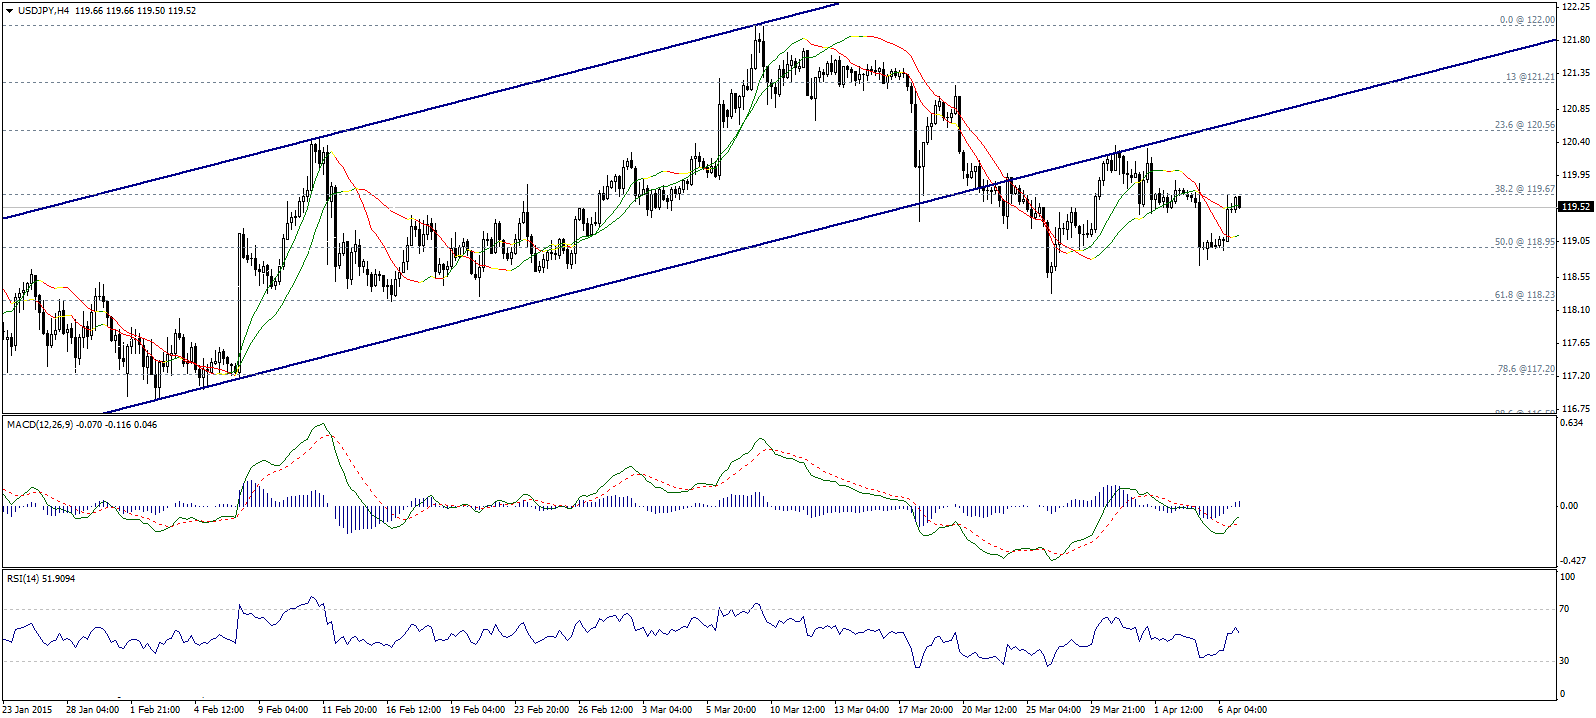
The USD/JPY pair is trading between 38.2% and 50% Fibonacci corrections located at 119.65 and 118.95 as we notice on the image above. Trading below the main support of the uptrend that turned into resistance will keep the bearishness probability valid.

Only breaching up 120.55 will weaken the bearishness, while breaching down 118.95 will confirm bearish expectations.

USD/JPY Support Resistance & Recommendation

USD/CHF - Technical Report

USD/CHF Daily Chart

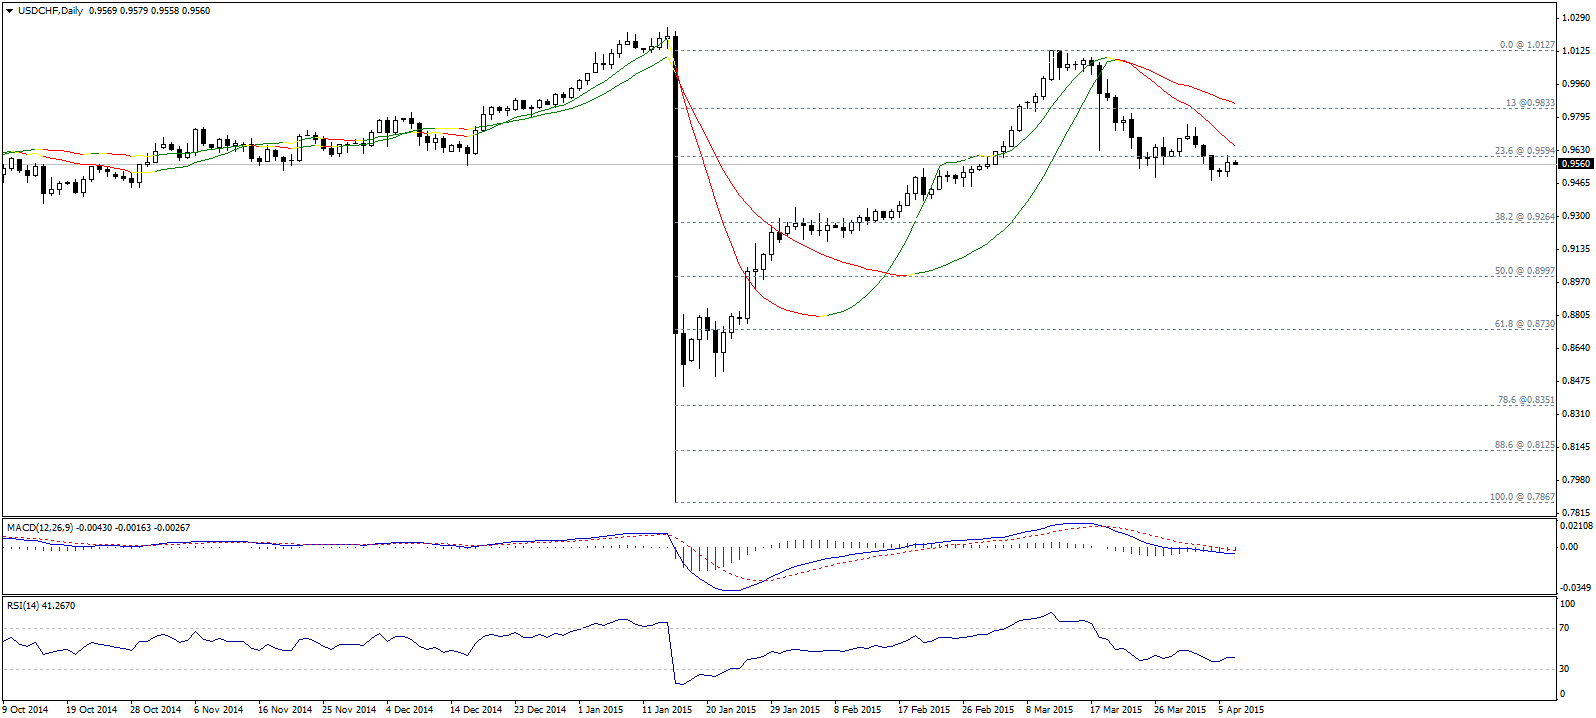
The USD/CHF pair is trading below 0.9595 resistance level, and below linear regression indicators. Trading below the aforesaid level 0.9595 presented by 23.6% Fibonacci correction will keep the probability of another bearish wave; targeting 38.2% Fibonacci correction at 0.9265.

From the upside, breaching 0.9660 will weaken our expectation. Off note, MACD indicator seems to be negative, while RSI 14 indicator is trading below 50.00 resistance line.

USD/CHF Support Resistance & Recommendation

USD/CAD - Technical Report

USD/CAD 4-Hour Chart

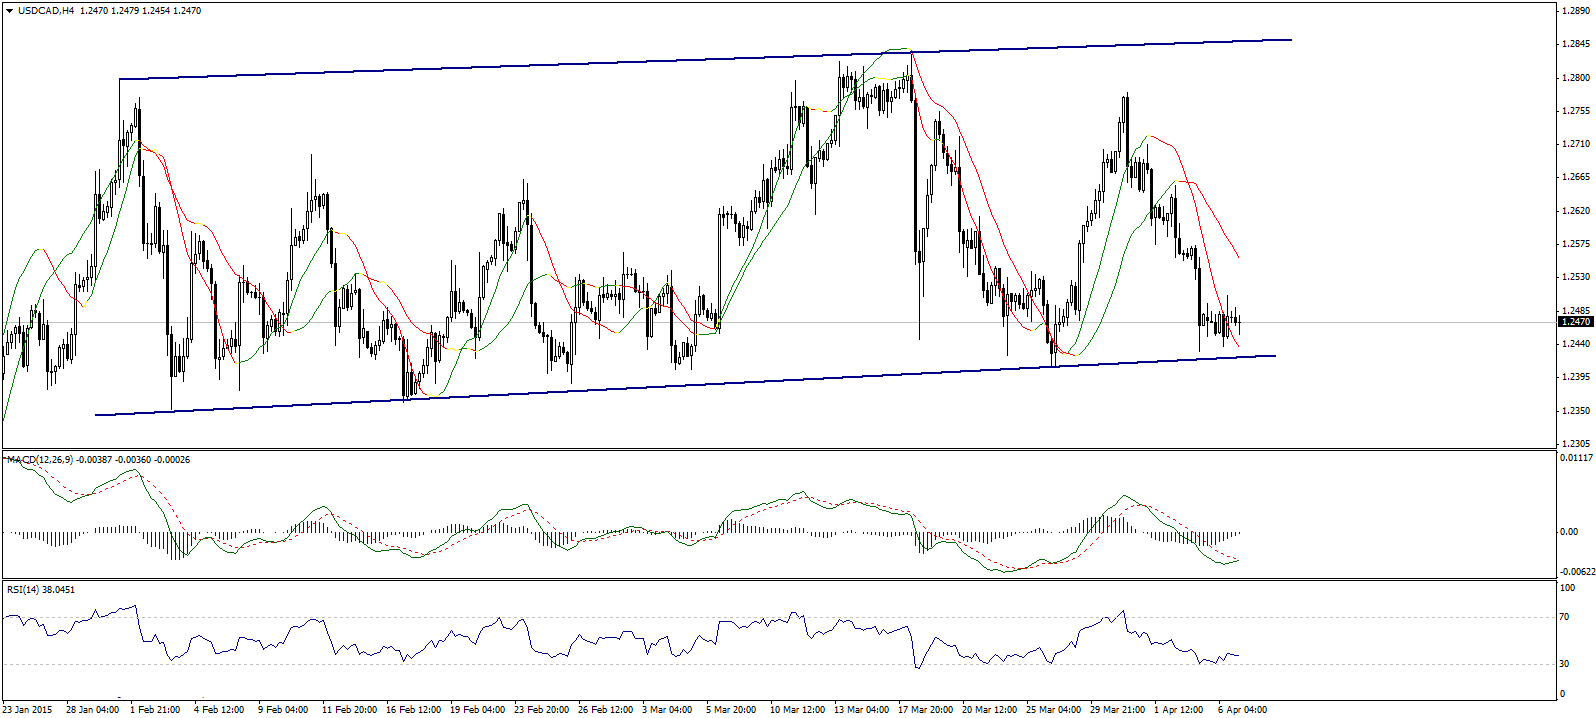
The USD/CAD pair trading near the main support of the sideways trend as the image shows. Trading above 1.2405 will push the pair higher. MACD indicator showing a positive crossover attempt. RSI14 indicator rose after touching the 30.00 point support.

Breaching 1.2405 will cause a bearish wave this week.

3rd party Ad. Not an offer or recommendation by Investing.com. See disclosure here or remove ads .

USD/CAD Support Resistance & Recommendation

AUD/USD - Technical Report

AUD/USD Daily Chart

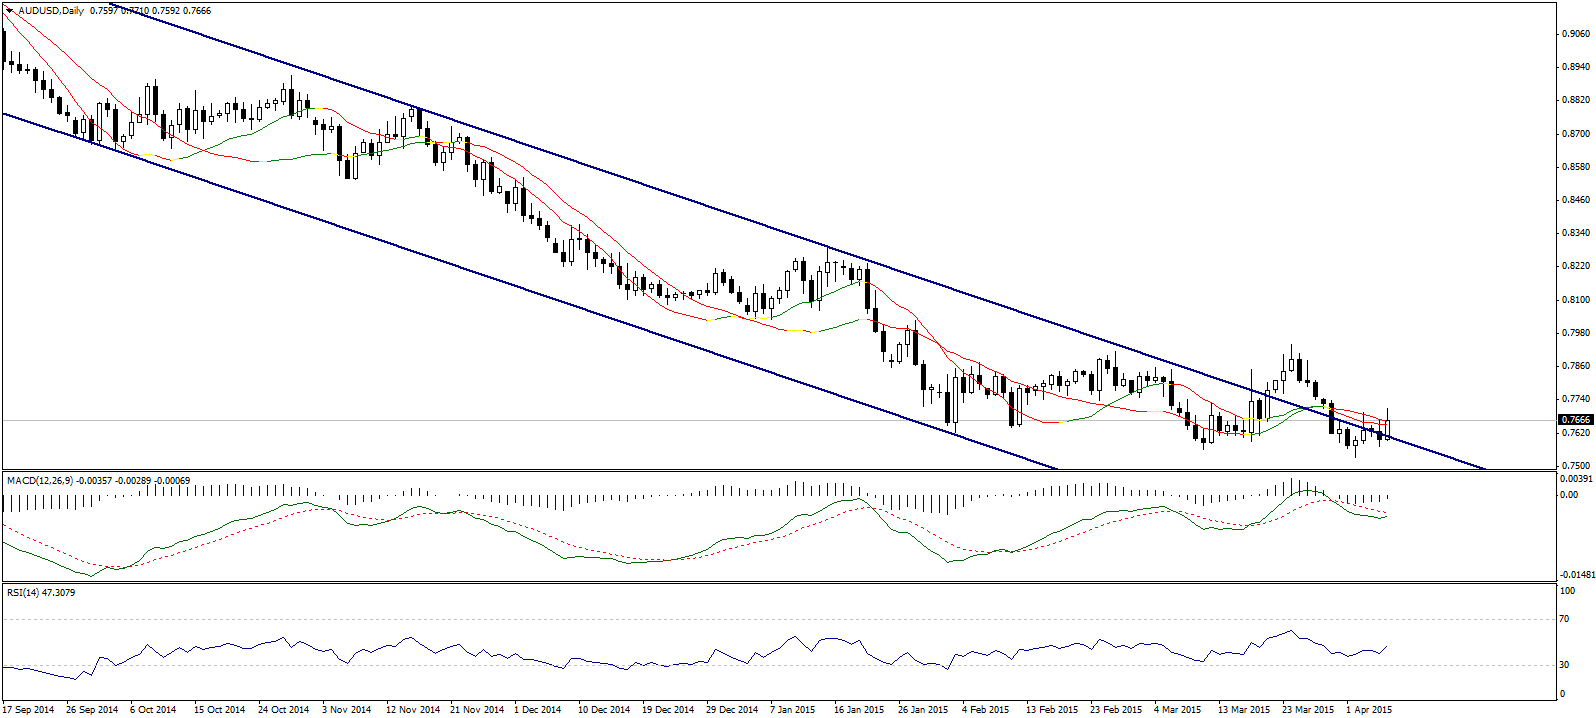
The AUD/USD pair is trading above the main resistance of the downtrend once again as we can notice on the daily chart shown on the image above. Trading above 0.7530 may keep the probability of uptrend emerge; however, breaching 0.7940 later this week is needed to confirm the bullish expectation.

We will use the classical technical fact of trading above the main resistance turned into support at 0.7600 to expect bullish wave during the next sessions.

AUD/USD Support Resistance & Recommendation

NZD/USD - Technical Report

NZD/USD Daily Chart

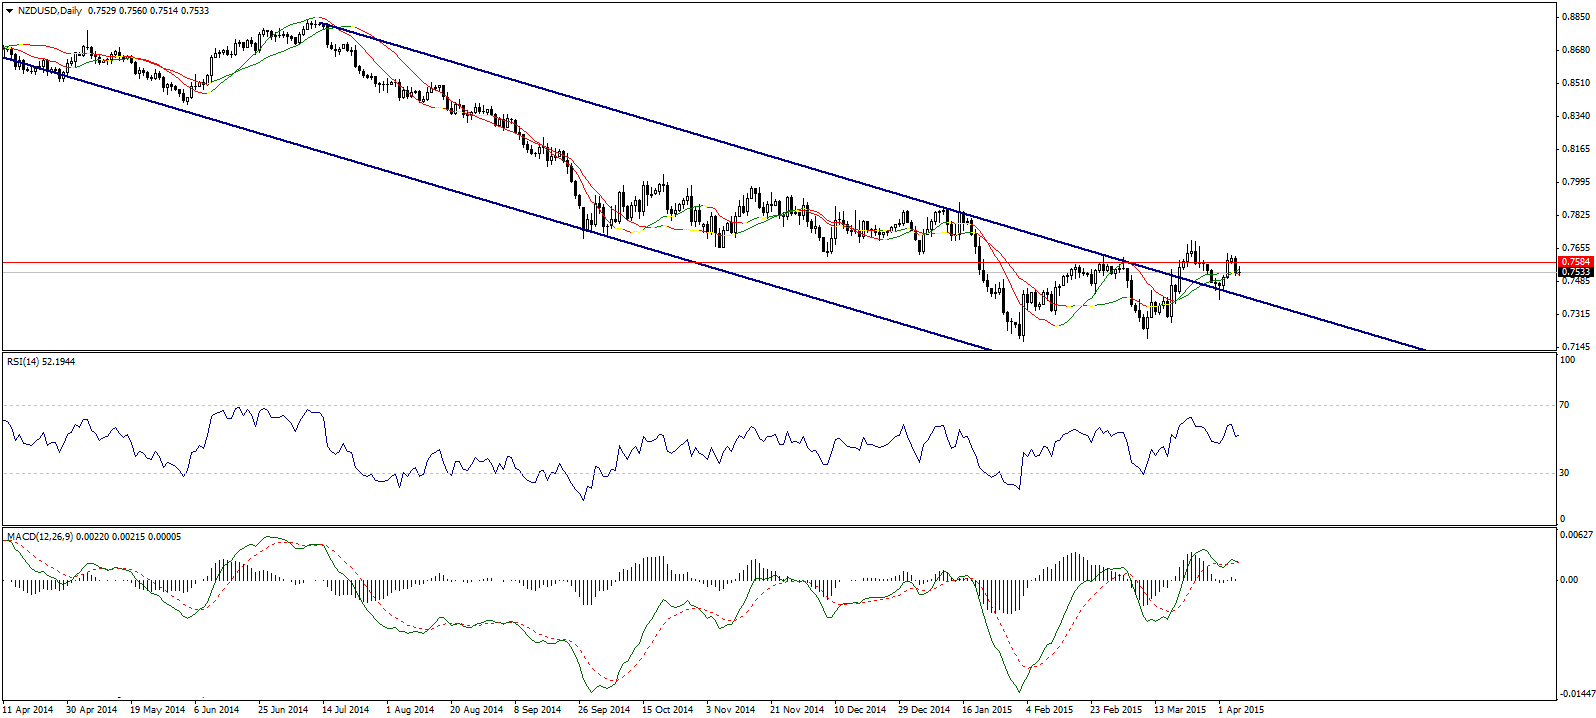
Once again, NZD/USD pair failed to maintain trading above 0.7585 resistance level, and that caused a down movement yesterday. However, the pair still trading above the main resistance of the down channel as we can see in the image above.

Trading between 0.7585 and 0.7400 forces us to stay neutral to watch price behavior between the aforesaid levels.

NZD/USD Support Resistance & Recommendation

Latest comments

Risk Disclosure: Trading in financial instruments and/or cryptocurrencies involves high risks including the risk of losing some, or all, of your investment amount, and may not be suitable for all investors. Prices of cryptocurrencies are extremely volatile and may be affected by external factors such as financial, regulatory or political events. Trading on margin increases the financial risks.
Before deciding to trade in financial instrument or cryptocurrencies you should be fully informed of the risks and costs associated with trading the financial markets, carefully consider your investment objectives, level of experience, and risk appetite, and seek professional advice where needed.
Fusion Media would like to remind you that the data contained in this website is not necessarily real-time nor accurate. The data and prices on the website are not necessarily provided by any market or exchange, but may be provided by market makers, and so prices may not be accurate and may differ from the actual price at any given market, meaning prices are indicative and not appropriate for trading purposes. Fusion Media and any provider of the data contained in this website will not accept liability for any loss or damage as a result of your trading, or your reliance on the information contained within this website.
It is prohibited to use, store, reproduce, display, modify, transmit or distribute the data contained in this website without the explicit prior written permission of Fusion Media and/or the data provider. All intellectual property rights are reserved by the providers and/or the exchange providing the data contained in this website.
Fusion Media may be compensated by the advertisers that appear on the website, based on your interaction with the advertisements or advertisers.
© 2007-2024 - Fusion Media Limited. All Rights Reserved.