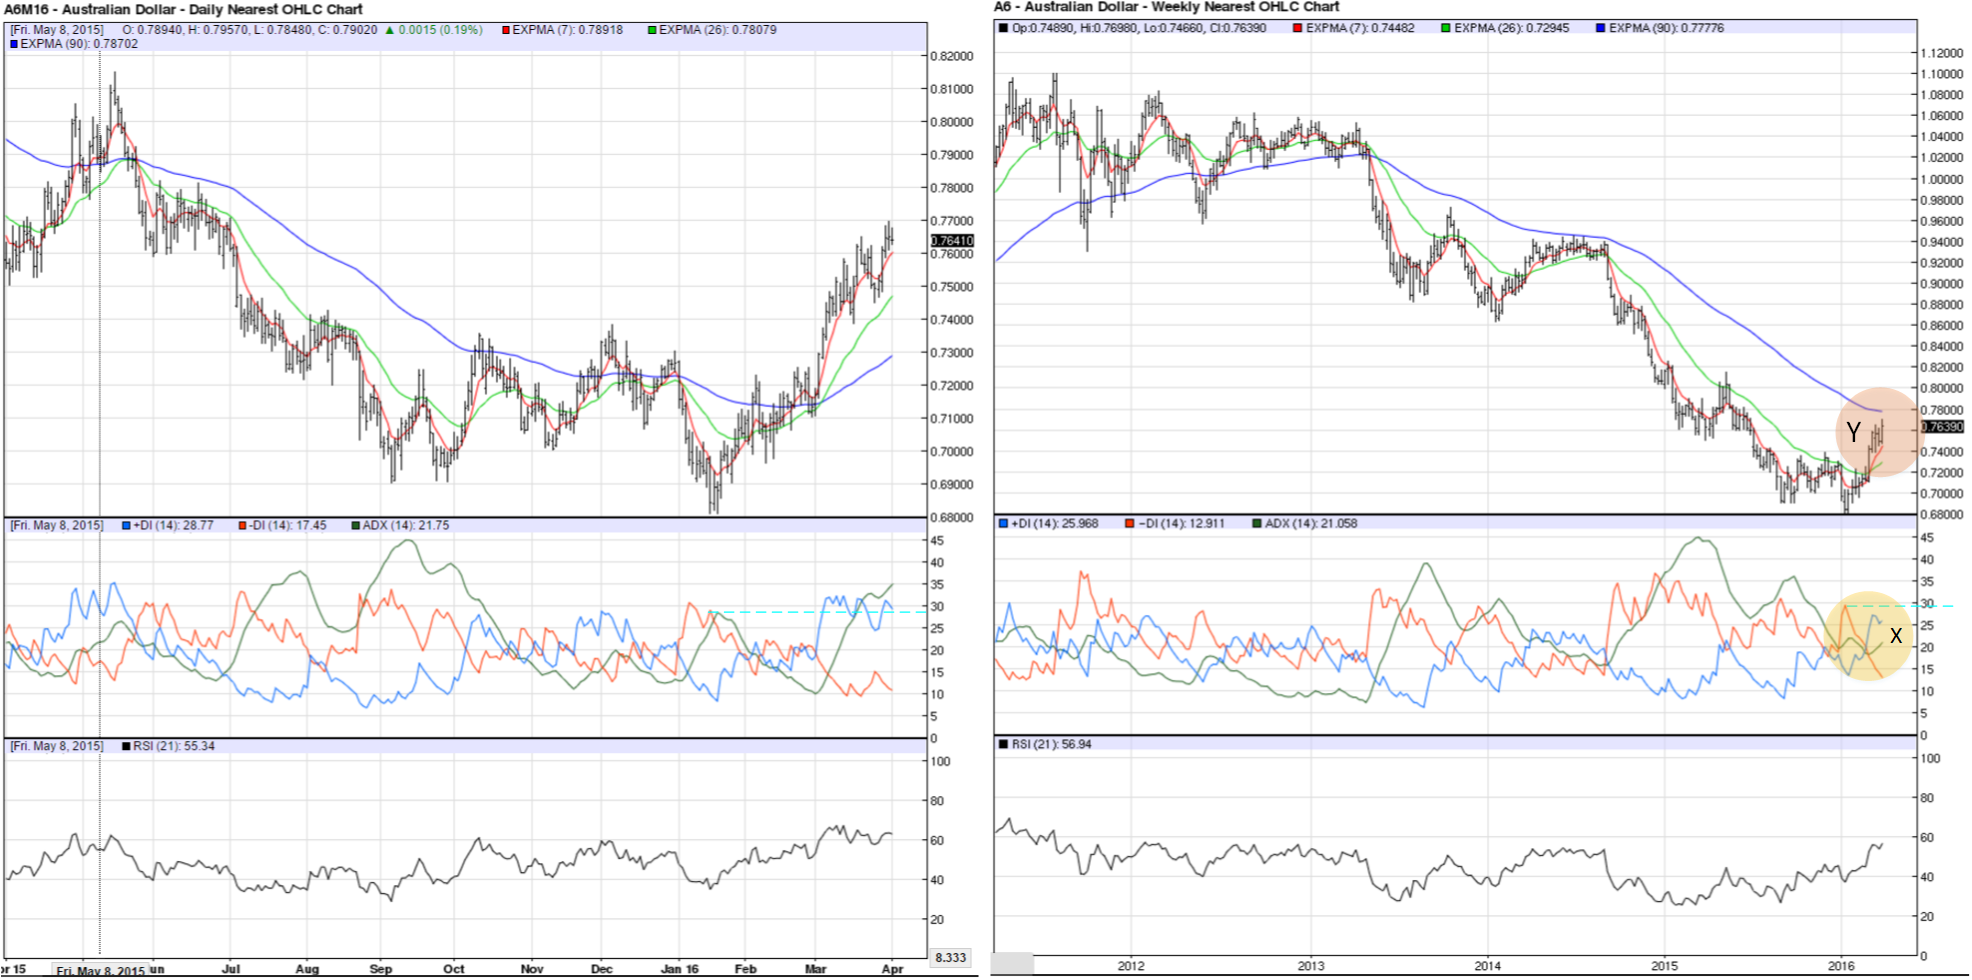
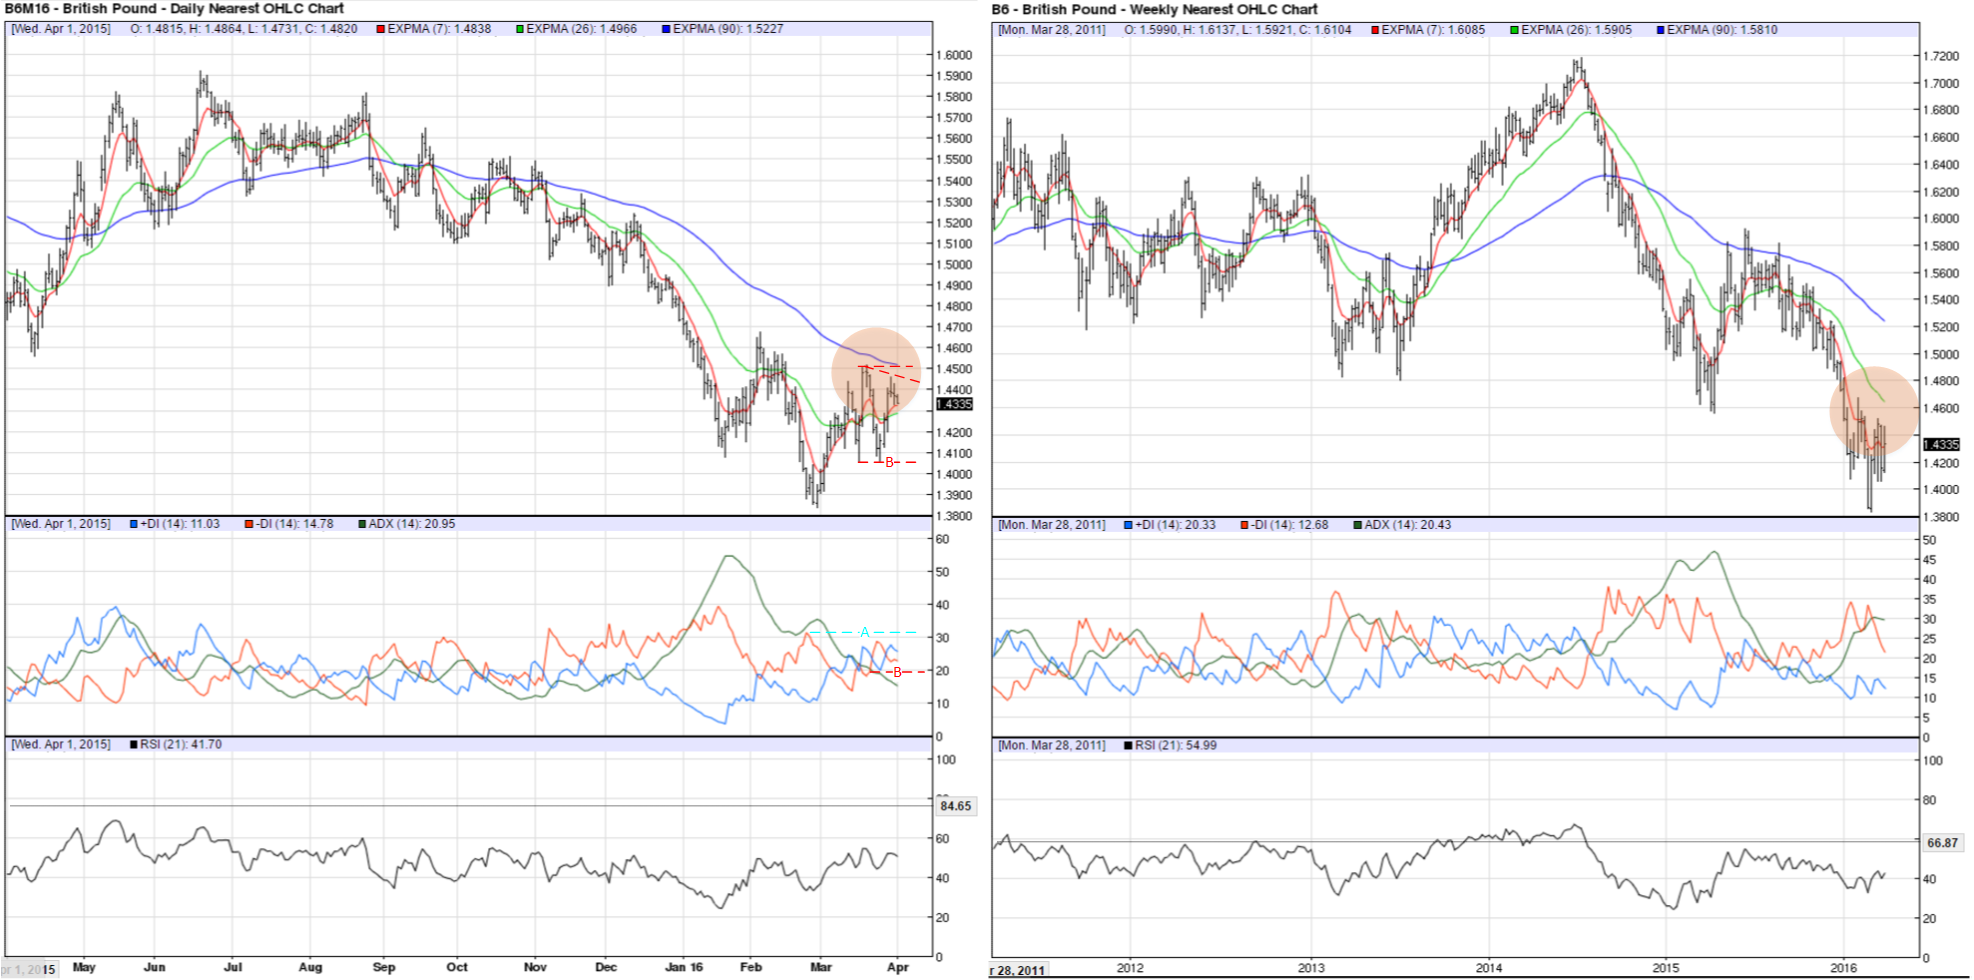
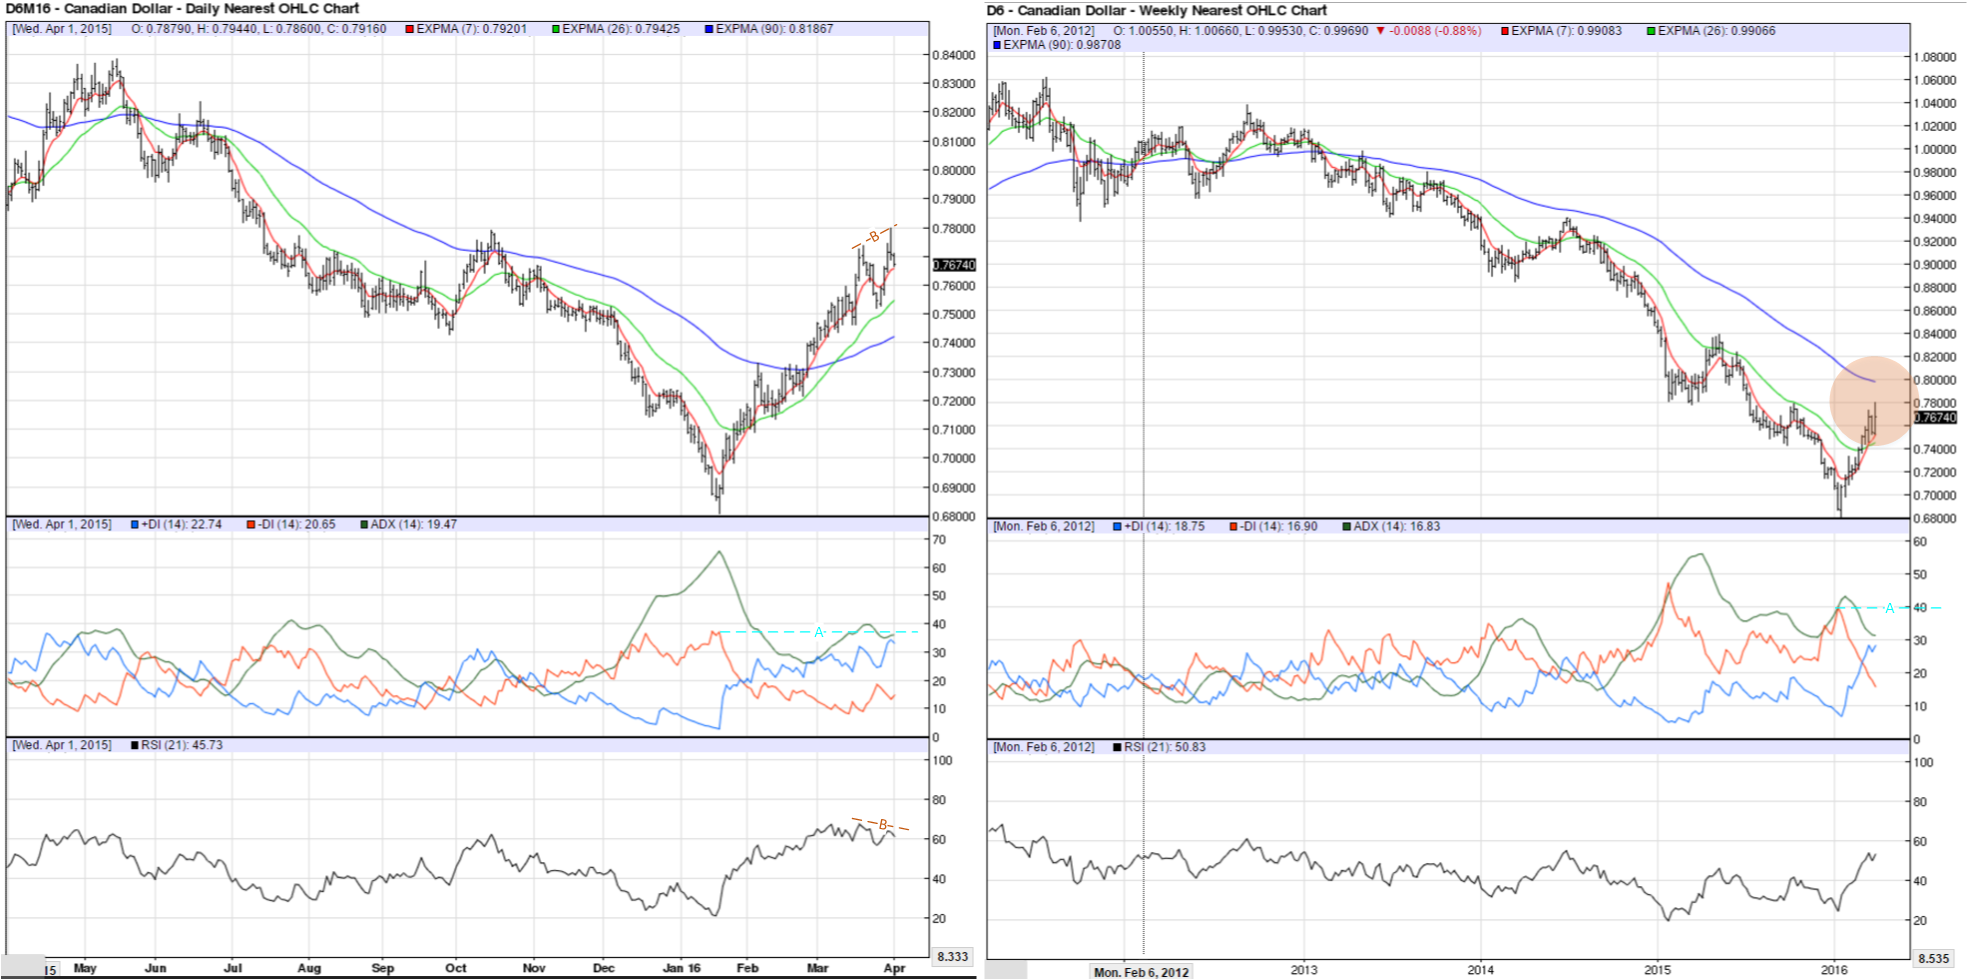
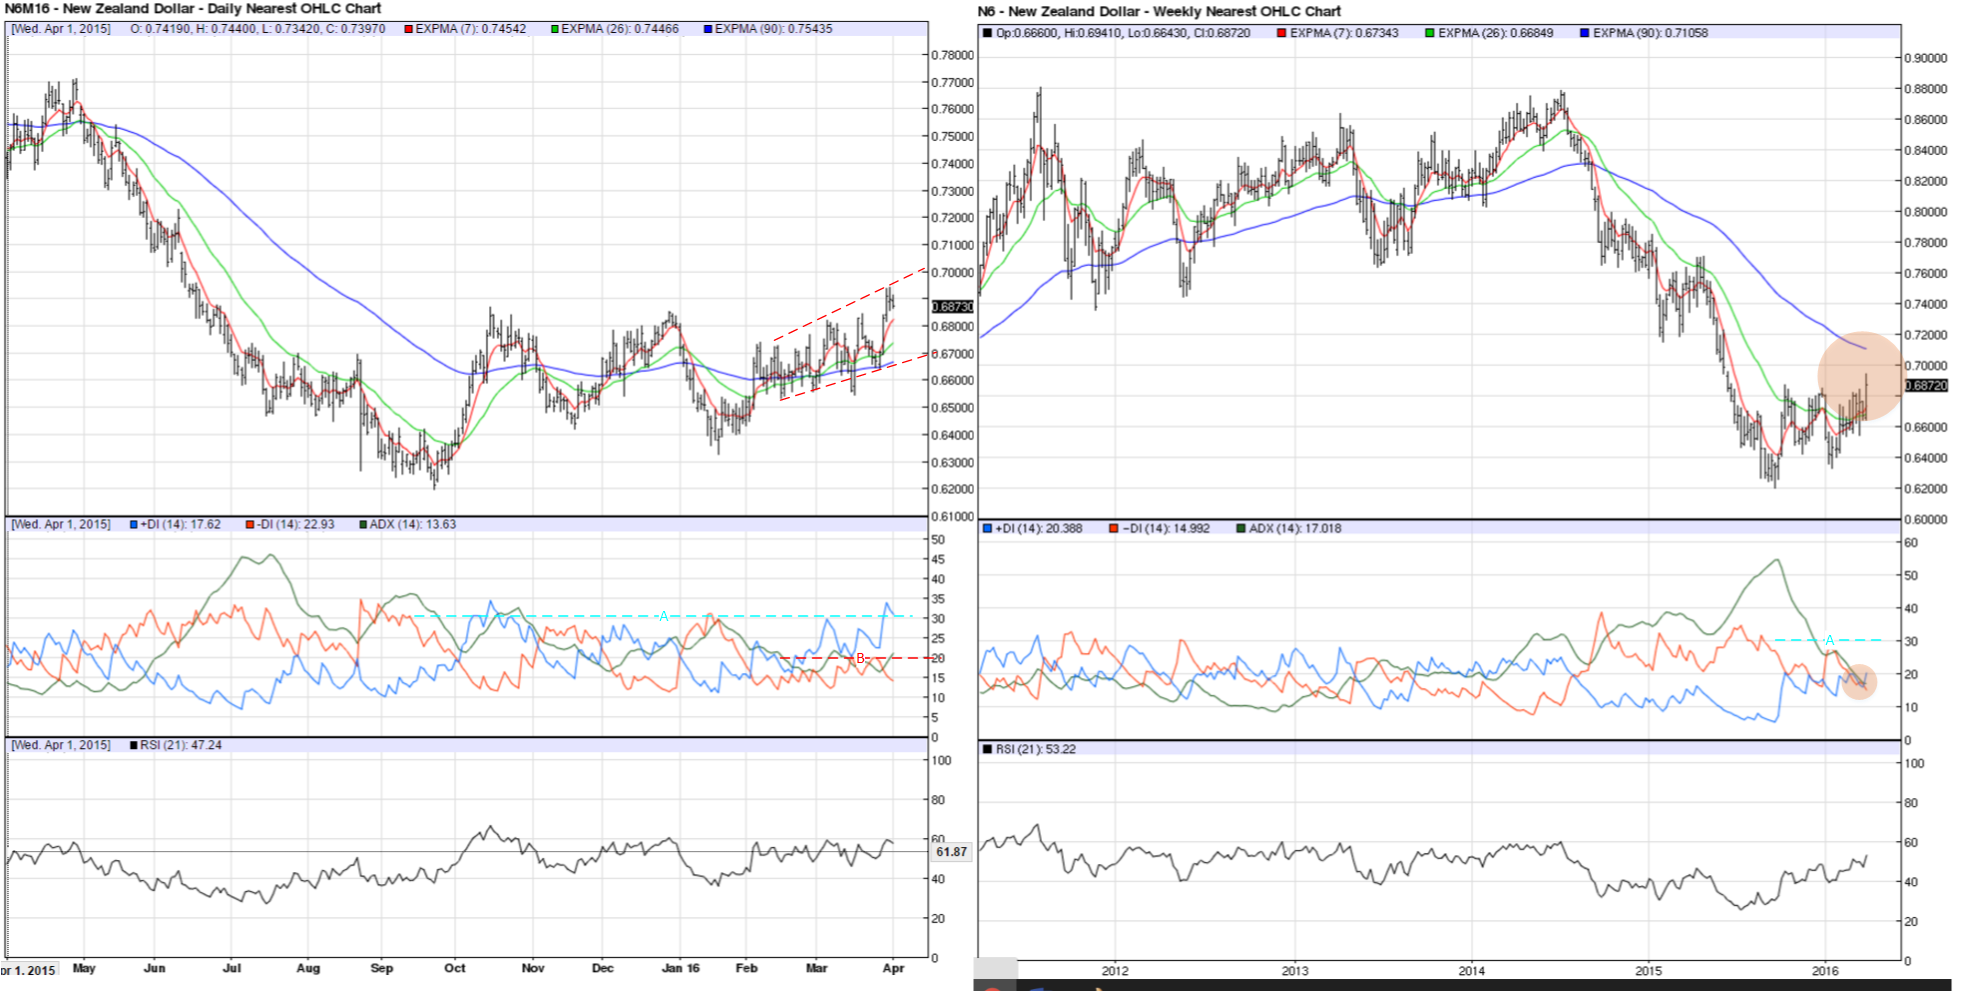
Bottom line: With the exception of the British pound, the Australian, Canadian, and New Zealand currencies have all had a nice run up. Looking at the daily charts alone, one could interpret this as a possible beginning of a new bull run. However, when considering the weekly charts in the mix too, it looks like these currencies could be close to hitting some serious resistance.
Australian dollar 
Weekly
-The 90 period (90P) EMA may be in for stiff resistance (Y). Price has had a good run up and has pulled the 7P EMA through the 26P, but in the scale of the downtrend starting late 2013, this is a very small and short move to-date. Even though the daily price has been quite bullish, the weekly EMAs should be strongly considered as heavy influencers of either price or the shorter-term EMAs. For example, price could move above the 90P EMA and close above it too. If, however, the 7P and 26P do not move above and hold, then the 90P resistance is still in play.
-The peak of the -DI that coincides with the low in price is still in play and has not been taken out by the +DI even with the recent price action (X). Additionally, with the ADX trending down now for several months and moving close to 20, it is a possibility that it will. A move into this range could trigger a consolidation in price.
-The 21P RSI has moved through the 50 range.
Daily
The EMAs on the daily chart are screaming uptrend. Along with the 21P RSI moving above 50 and holding and the +DI taking out the -DI that corresponds to the low in price, a possible strategy could be to buy on the next pullback. However, as stated earlier, the weekly chart must be considered before taking a position to the long side.
British pound 
Weekly
-The weaker of the 4 currencies reviewed here, the pound appears to be stalling going into the 26P EMA. It is possible that price moves into the indicator, pulling the 7P close but not close enough to cross. Failure to move through the 26P with price could result in continuation of bearish trend
-The ADX and -DI are bearish. Any pullbacks at this point could be viewed as an opportunity to enter the market on the short side. A pullback could be considered any price movement into the 26P EMA and holding there
-The 21P RSI has held at the 40 – 50 range, but a move below 40 could be viewed as confirmation of the continuation of the downtrend.
Daily
The daily price action over the past month can be viewed as a period of consolidation. With the +DI unable to takeout the -DI from the price low (A) and the ADX dropping below both 20 and the +/-DI (B), price has traded in a wide, controlled range. Currently, there does appear to be a good bottom in place for support, but there are several options on the resistance side including the 90P EMA.
Canadian dollar 
Weekly
-The 90P EMA is looming large above the current move up in price. Close attention should be paid to price as it nears this line. Should the 90P hold either price, the 7/26P EMA or both, then either a continuation of the downtrend or a more complex correction may follow.
-The ADX is strong though; it has pulled back from its earlier highs. Attention should be paid to the +DI as it has crossed the -DI but is well down from taking it out. Should the +DI take out the -DI in this current move up, a change in dominance would be in play and future price movement to the upside would be possible
-The 21P RSI has pulled in the 50 range, and should it hold, it will provide resistance to support the price action, meeting resistance at the 90P EMA
Daily
Again, like the Australian dollar, this market looks strong on the daily chart regarding price and the EMAs. However, when considering the ADX and +/-DI and the +DI’s inability to take out the -DI (A), a divergence in the 21P RSI with Price (B), there is no real confirmation that the current uptrend will continue.
New Zealand dollar 
Weekly
The analysis for the New Zealand dollar is similar to that of the Canadian dollar. By examining the weekly chart, the 90P EMA is again looming above current price action and should provide strong resistance to either price or the other EMAs. And, the current action of the +DI against the -DI does not lend itself to a bullish move continuing. In fact, the ADX is giving signs like it will drop below 20 and/or the +/-DI, which could lead to a period of consolidation on the weekly chart. The 21P RSI has moved into the 50 range.
Daily
On the daily chart, the 7P and 26P EMA have been moving around the 90P EMA for several months, with price moving in a similar fashion. The ADX has moved into a tight range at or below 20 for the most part, and a nice price channel has formed during this time frame.
What to watch:
For all four of these currencies, price action on the weekly chart near the 90P EMA should be considered an important hinge. Based on how they swing on this point, it may become more clear if the downtrend is continuing, a possible more complex correction is in play, or a trend reversal is in its early stages.
