* Market share battles have ONE consistent by-product: Prices gets eviscerated
* Current market elements favor a short term bullish posture
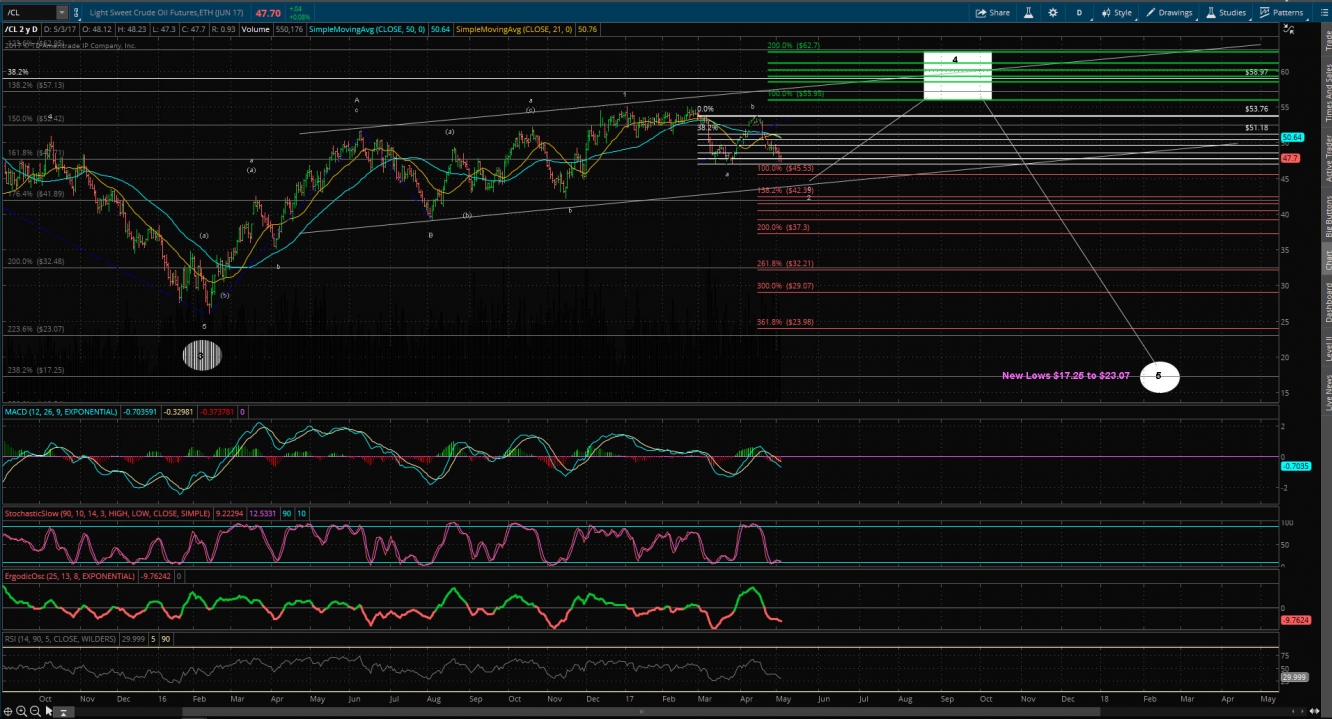
* Ultimately price appears to be headed to $20 level
Market-Share Battles Effect on Price
The November 2014 announcement by Saudi Arabia to increase output to defend market-share has had a devastating effect of the price of oil. Their strategy was simple; Flood the global market with oil, drive the price below profitable levels for US shale, and force the industry to remove production capacity. The gamble was their increased output would largely be offset by the contraction in the US. Lastly, the strategy would aim to remove the US shale industry as a global swing producer.
From 2014 to middle of 2016 that strategy was successful.
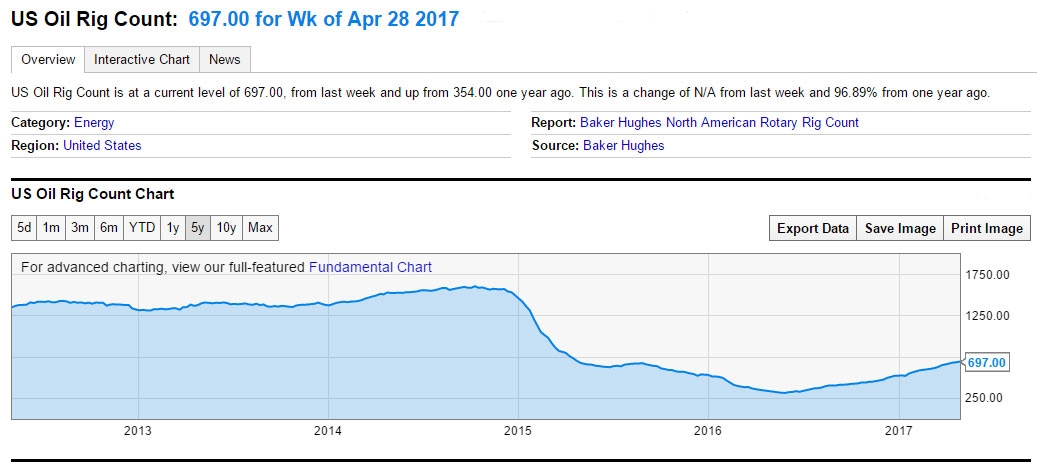
From the chart above you can see the Saudi strategy (initiated end of 2014) had an immediate impact as US drillers took a large amount of capacity offline. From January 2015 to May 2016 active rigs in the US went from approximately 1700 to just over 300. A massive reduction in drilling rigs.
However, the Saudi's did not anticipate that by early 2016, US drillers were gaining higher output efficiency during the price decline. Fast forward to today, the US is producing approximately 9.3M bpd with 672 active rigs versus 9.6M bpd with 1700 active rigs in 2014.
Current market elements favor a short term bullish posture
Three market events that will have positive effects on the price of oil are (1) Seasonality, (2) May 25 OPEC meeting, and (3) Saudi Aramco IPO in the area of Q1 2018.
Since I am primarily a technical trader, I don't afford these elements huge weight in my trading decisions. However, when events like these match my shorter term price expectation it does serve as a confidence booster.
Ultimately price appears to be headed to $20 level
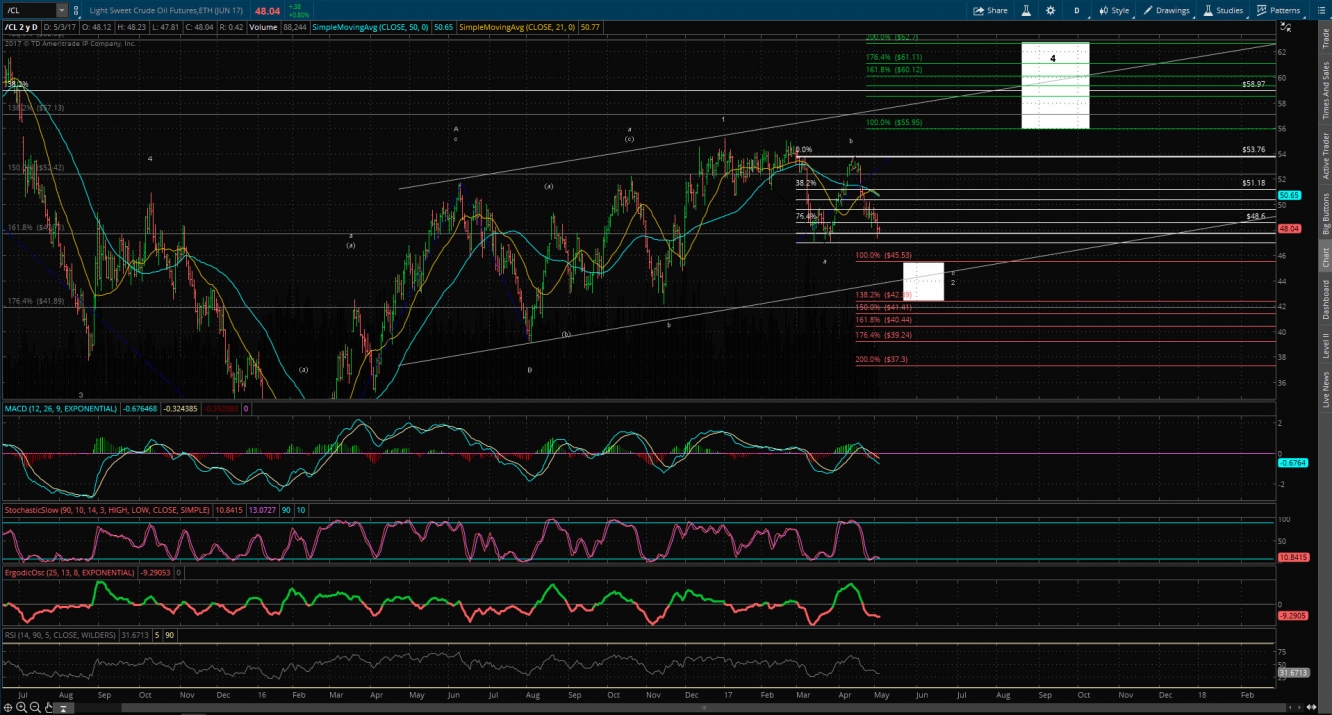
I am shorter term bullish and longer term bearish. Largely because I do not feel we have completed a proper retracement of the decline. In our trading room at Oil Gas Analysis we are tracking the shorter term bullish expectation as per the below chart.
Based on our analysis, we are entering the final gyrations of a intermediate term bottom in the $45 to $43 range. After which oil should complete a larger wave corrective rally in the area of $58 to $65.
Longer term we are tracking the below price pathway, which projects into the low $20's to high teens.
In conclusion, it appears price will continue to be eviscerated as this market share battle plays out. After a short term bullish relief rally, it appears the commodity may eventually reside much-much lower before we can all decide which of the producers won.


