🔮 Better than the Oracle? Our Fair Value found this +42% bagger 5 months before Buffett bought itRead More

Crude Oil Needs A New Low

Published 08/01/2016, 09:52 AM
Updated 01/11/2024, 05:37 AM
CL
-

Last Friday, crude bounced from its low at 40.50 (.20c below 162% extension level where we bought) and tested 41.40, but not as clearly as to be considered as a bottoming sign, and this leads us to expect another downside up to $38 in the coming hours or days.

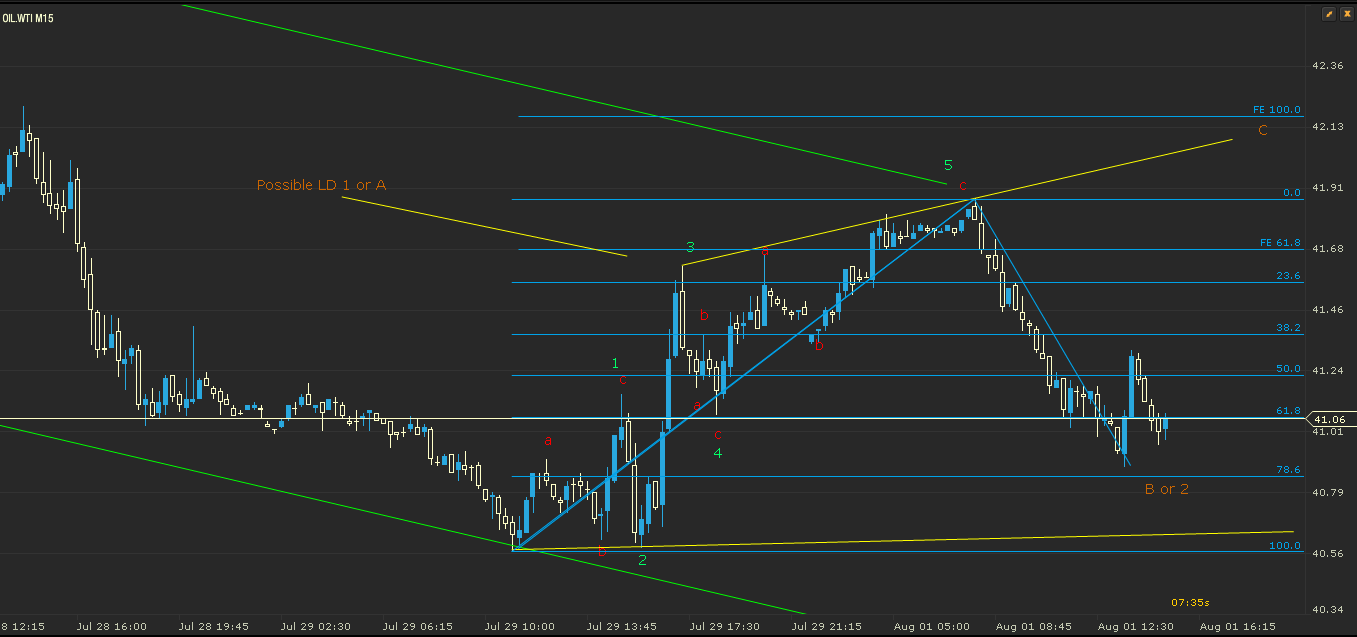
There are two ways we can count the bounce: 1) LD 1 or 2) W-X-Y

Crude 15-min - August 1, 2016
Crude Oil M15 Chart

In this 15-min chart, we have counted the bounce as a Leading Diagonal structure where each wave has 3 inner waves. Under this scenario, crude holds previous low and targets above $42-$42.40.

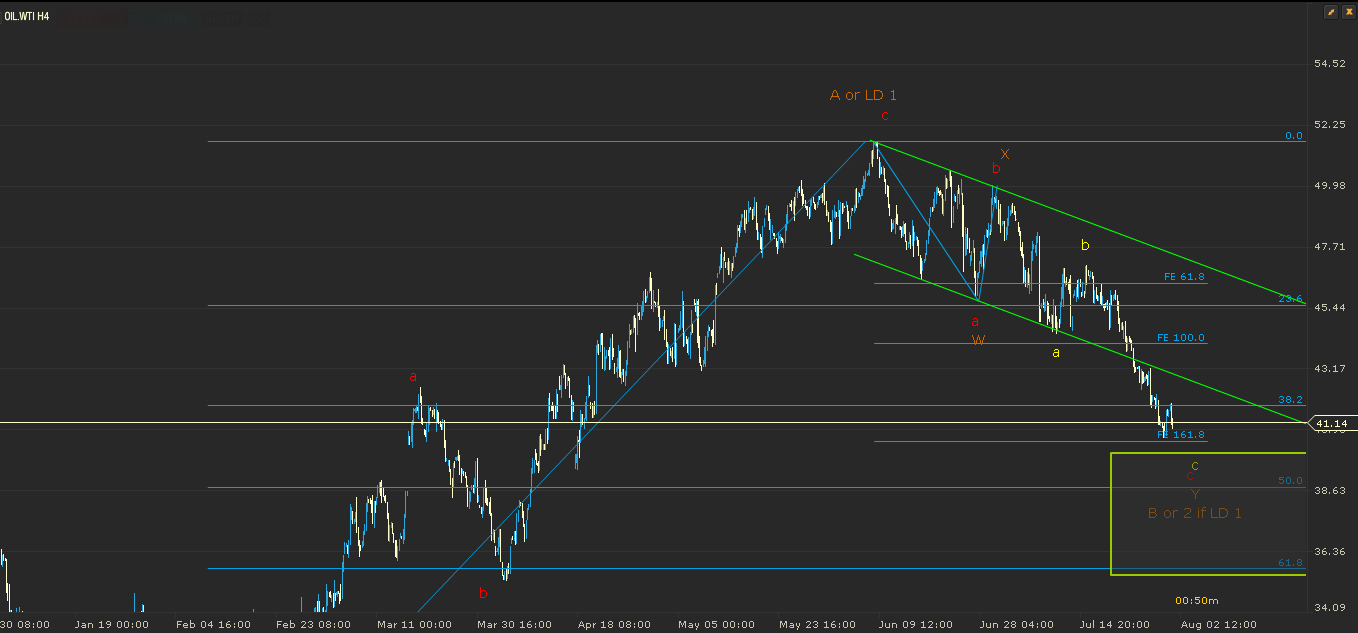
The second possibility is if the entire move is a double 3 correction and crude makes a new low towards 50% fibonacci.

Green wave 1-2-3 can construct corrective W; wave 4 = X; and wave 5 = Y

Crude 4H Chart - August 1, 2016
Crude Oil 4H Chart

In this 4H chart, crude needs a new low to complete 5 waves for yellow wave c and put an end to this possible B wave or 2 if LD 1.

Downside targets to watch for are 50% & 62% retracement of entire rally.

Latest comments

Loading next article…
Risk Disclosure: Trading in financial instruments and/or cryptocurrencies involves high risks including the risk of losing some, or all, of your investment amount, and may not be suitable for all investors. Prices of cryptocurrencies are extremely volatile and may be affected by external factors such as financial, regulatory or political events. Trading on margin increases the financial risks.
Before deciding to trade in financial instrument or cryptocurrencies you should be fully informed of the risks and costs associated with trading the financial markets, carefully consider your investment objectives, level of experience, and risk appetite, and seek professional advice where needed.
Fusion Media would like to remind you that the data contained in this website is not necessarily real-time nor accurate. The data and prices on the website are not necessarily provided by any market or exchange, but may be provided by market makers, and so prices may not be accurate and may differ from the actual price at any given market, meaning prices are indicative and not appropriate for trading purposes. Fusion Media and any provider of the data contained in this website will not accept liability for any loss or damage as a result of your trading, or your reliance on the information contained within this website.
It is prohibited to use, store, reproduce, display, modify, transmit or distribute the data contained in this website without the explicit prior written permission of Fusion Media and/or the data provider. All intellectual property rights are reserved by the providers and/or the exchange providing the data contained in this website.
Fusion Media may be compensated by the advertisers that appear on the website, based on your interaction with the advertisements or advertisers.
© 2007-2024 - Fusion Media Limited. All Rights Reserved.