Talking Points
- Crude Oil Awaits Inventories Data As Supply Glut Concerns Persist
- Natural Gas Extends Declines As Supportive Weather Speculation Fades
- Quarterly Forecast: Gold Remains Vulnerable To USD Strength
The precious metals are witnessing a mixed session in early European trading today as their US Dollar counterpart struggles to extend Tuesday’s gains. Looking ahead US ISM Non-Manufacturing data headlines the US economic docket. The leading indicator for the health of the US economy is tipped to recover slightly and remain well within expansionary territory.
ADP figures also offer a piece of event risk with their potential to shape expectations for Friday’s Non-Farm Payrolls print. As noted in recent reports sentiment towards the USD has been generally positive and may prove difficult to turn without a significant deterioration in US data. This in turn leaves gold and silver in precarious positions.
Meanwhile, crude oil is seeing modest gains for the session thus far with US inventories figures looming ahead. The Weekly Petroleum Status Report from the Department of Energy is tipped to reveal the third consecutive rise in total crude stocks. As noted in prior reports; recent figures from the government agency show the rate of US crude production has climbed to multi-decade highs. This suggests global supply glut concerns may prove difficult to alleviate, which in turn could keep pressure on WTI over the medium-term. At the same time given the extent of declines over recent weeks, profit-taking and a corrective bounce should not be precluded over a shorter time horizon.
Also in the energy space; Natural Gas has suffered another dramatic drop (-3.3 percent on Tuesday) with newswires pointing to fading support from weather-related factors. Milder weather conditions in the Northern US States may threaten to reduce heating demand for the energy commodity. Yet as the US winter draws nearer a resurfacing of polar vortex fears may spell further volatility for natural gas.
ECONOMIC EVENTS
CRUDE OIL TECHNICAL ANALYSIS
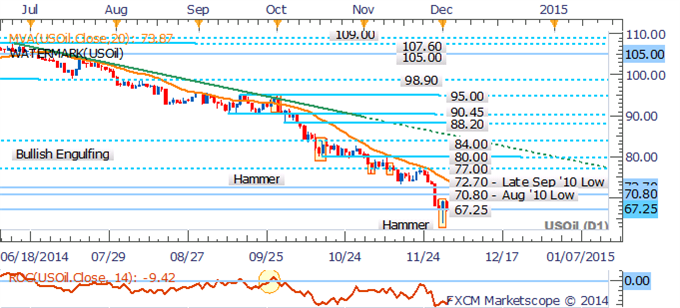
Crude oil’s retreat to the 67.25 floor has left a Hammer formation lacking confirmation. Amid the core downtrend that remains intact the risks may be skewed lower for the commodity. A close beneath the barrier would potentially set the stage for a push towards the August 2009 low near 60.74.
Crude Oil: Pullback To Key Support Negates A Bullish Pattern
GOLD TECHNICAL ANALYSIS
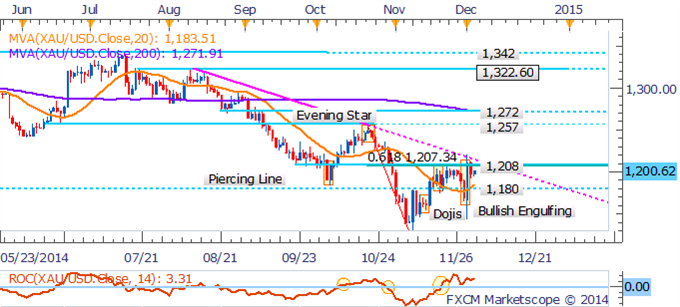
Gold has pulled back for the descending trendline on the daily, which has left a Bullish Engulfing formation lacking confirmation. While the precious metal is struggling to clear some overhead hurdles it may be too soon to call for a reversal lower. This is given that trend indicators including the 20 SMA and ROC remain pointing higher. Buying interest may emerge at the 1,180 mark.
Gold: Trendline Resistance Keeps Gains Capped
SILVER TECHNICAL ANALYSIS
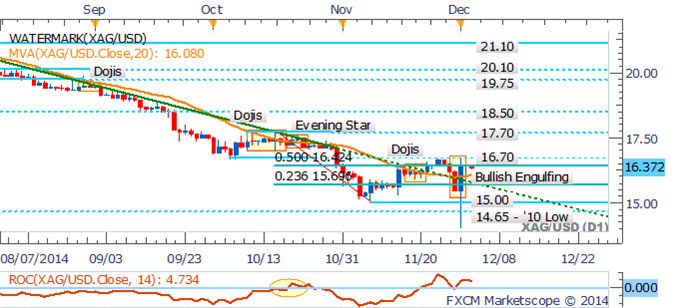
Silver is keeping traders in suspense sub the 16.70 mark and near the 50% Fib. A Doji on the daily suggests further hesitation from traders to lead the precious metal higher. However, in the absence of a more definitive reversal signal caution is suggested when looking to play a pullback.
Silver: Doji Suggests Reluctance Sub The 16.70 Mark
COPPER TECHNICAL ANALYSIS
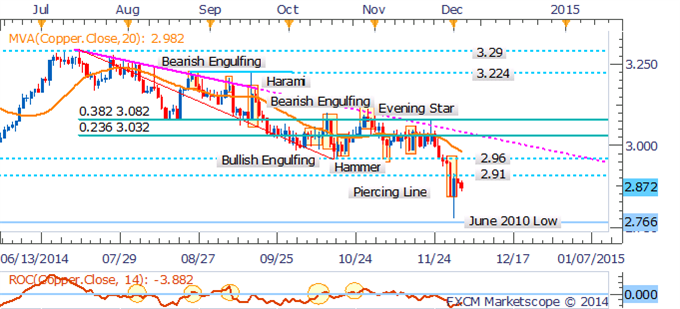
Copper’s downward tilt is still present despite the recent retracement. The signs of a downtrend from the 20 SMA and ROC suggestthe risks are likely skewed to the downside. This in turn puts the June ’10 low in sight with sellers sitting nearby at the 2.91 ceiling. However, caution is still suggested when adopting fresh positioning - given the commodity’s tendency towards whipsaws over recent months.
Copper: Sights Set On June Lows
Palladium TECHNICAL ANALYSIS
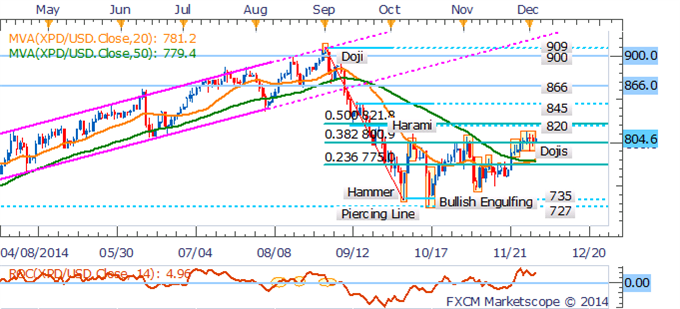
Palladium is struggling to sustain its recent gains near the 38.2% Fib. This has left a pair of Dojis in its path. However, the candlestick formations are not considered key reversal patterns. Alongside signs of an emerging uptrend a pullback remains questionable.
Palladium: Struggles Near The 38.2% Fib.
PLATINUM TECHNICAL ANALYSIS
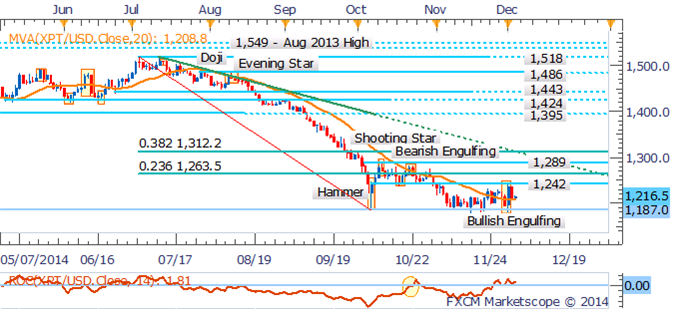
Platinum has produced a Bullish Engulfing formation after bouncing from the 1,187 floor. Yet confirmation from a successive up-period and close above the 1,242 ceiling would be required before the potential for a continued ascent would be made possible.
Platinum: Bullish Engulfing Pattern Emerges Near Key Floor
