Forex News and Events
Is this light at the end of the tunnel? (by Arnaud Masset)
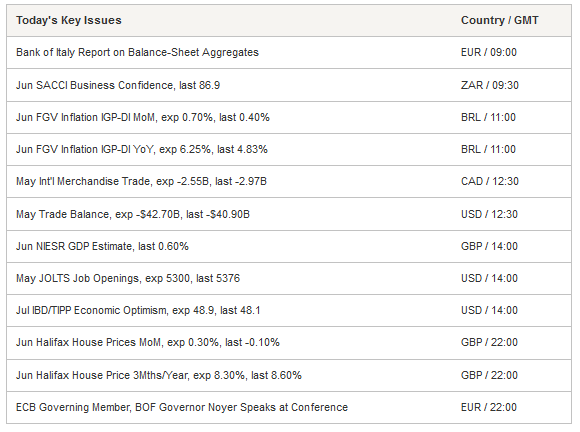
Yesterday, the BCB released its weekly survey. And the report showed that even though analysts raised again their inflation anticipation for the end of 2015 to 9.04% from 9% a week earlier, they also reduced their estimates for 2016 - closer to the 4.5% target - to 5.45% from 5.5% a week earlier. It’s a small step but it may be the beginning for a trend reversal as it suggests that the Central Bank’s efforts to restore its credibility have finally paid off.
However, the future doesn’t look that bright for the Brazilian economy according to median forecast. The report shows that economists lowered their estimates for 2015 GDP to -1.50% from -1.30% a month ago while they anticipate industrial production to contract 4.72% during the same year. We think that the Brazilian economy will suffer more than previously anticipated as the BCB still need to anchor its renewed credibility and has to continue its fight against elevated inflation. At the moment, we expect the BCB to increase the Selic rate by another 50bps at its next meeting on July 29th as the current weakness of the BRL will add more inflation pressure on the Brazilian economy.
Crude oil collapses (by Yann Quelenn)
Yesterday, oil prices collapsed at $52.94 a barrel after a nearly 6% decline. It is its lowest level since April. In less than two weeks WTI Crude prices have collapsed by 13%. Global uncertainties are pushing oil prices to the downside. Mounting evidences of this massive decline are given on both oil demand and supply. The global context confirms that surge oil was only temporary and we expect oil prices to remain low at least for some time.
The no-vote in Greece increased contagion fears that would certainly decrease oil demand in Europe. Furthermore the current blow-up of the Chinese stock market is likely to also decrease demand. Indeed, Chinese oil imports shrank by nearly 10% YoY in May. Furthermore an agreement between Iran and Western Countries is set to take place. And in this case, sanctions against Iran would be lifted off. However, as Iran has already announced, it will oversupply the oil market.
US drilling rigs counts have risen for their second consecutive week which will have a positive impact on the US production. At last, it is worth adding that OPEC production June report will be released next Monday and traders are concerned on a production increase. All those uncertainties weigh on the oil prices which is set to remain low for the summer. The WTI support at 49.88 is on target.
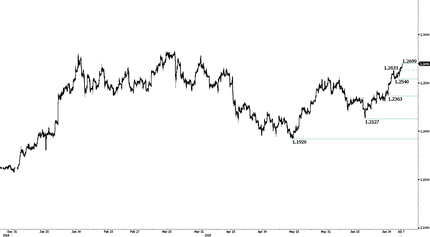
USD/CAD - Setting a 4-Month High 

The Risk Today
Yann Quelenn
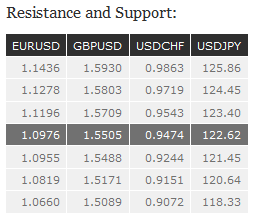
EUR/USD is declining toward support at 1.0955 (29/06/2015 low). Hourly resistance is at 1.1278 (29/06/2015 high). Stronger resistance lies at 1.1436 (18/06/2015 high). Hourly support is given at 1.0868 (28/05/2015 low). We expect the pair to remain below 1.1100. In the longer term, the symmetrical triangle from 2010-2014 favors further weakness towards parity. As a result, we view the recent sideways moves as a pause in an underlying declining trend. Key supports can be found at 1.0504 (21/03/2003 low) and 1.0000 (psychological support). Break to the upside would suggest a test of resistance at 1.1534 (03/02/2015 reaction high).
GBP/USD is now heading toward hourly support at 1.5488 (15/06/2015 low). Hourly resistance can be found at 1.5930 (18/06/2015 high). We expect the pair to decrease toward hourly support at 1.5488. In the longer term, the technical structure looks like a recovery bottom whose maximum upside potential is given by the strong resistance at 1.6189 (Fibo 61% entrancement).
USD/JPY is still heading lower. Hourly resistance can be found at 124.45 (17/06/2015 high) and stronger resistance still lies at 135.15 (14-year high). The technical structure still suggests a downside momentum as the pair is setting lower highs. A long-term bullish bias is favored as long as the strong support at 115.57 (16/12/2014 low) holds. A gradual rise towards the major resistance at 135.15 (01/02/2002 high) is favored. A key support can be found at 118.18 (16/02/2015 low).
USD/CHF is increasing slightly before challenging the hourly resistance at 0.9543 (27/05/2015 high). Stronger resistance can be found at 0.9721 (23/04/2015 high). Hourly support can be found at 0.9151 (18/06/2015 low). In the long-term, there is no sign to suggest the end of the current downtrend. After failure to break above 0.9448 and reinstate bullish trend. As a result, the current weakness is seen as a counter-trend move. Key support can be found 0.8986 (30/01/2015 low).

