Get 40% Off
🚨 Volatile Markets? Find Hidden Gems for Serious Outperformance
Find Stocks Now

Crude Oil Breaks 50 Dollar Mark On Surprise U.S. Stockpile Growth

Published 07/23/2015, 07:39 AM
Updated 07/09/2023, 06:31 AM

Talking Points:

  • WTI Oil crashed after EIA reported a surprise stockpile growth
  • Copper demand on LME at the weakest in two years
  • Gold pressured by good US data

Supply-demand drivers of commodities came to the forefront as oil crashed through $50 big level, copper fell to the lowest since July 8, and gold lowered to test a support level at 1085. The US dollar rose due to positive home sales data and fixed income demand, adding downside pressure on commodity prices.

WTI crude oil crashed below $50 mark, a multi-month support level since the March-May climb. The 3.3 percent fall in price came after the US Energy Information Administration reported a weekly rise in US inventories instead of a drop as previously expected. This echoed yesterday’s surplus report by the industry-funded American Petroleum Institute and further affirmed a US supply glut.

Bearish oil prices will likely persist in the near term and have led to a widening in WTI-Brent spread to the largest level since May. WTI oil lost almost 20 percent in the past six weeks while American supplies remain almost 100 million barrels above the five-year seasonal average.

An overnight drop in copper prices dragged down the rest of the industrial metal complex, after London Mercantile Exchange reported that copper demand was at the lowest since March 2013. Data showed that consumption has dried up whereas stockpiles have doubled in the past year. This was partially caused by a deflation in production costs that boosted copper supply.

3rd party Ad. Not an offer or recommendation by Investing.com. See disclosure here or remove ads .

Demand for copper from China is projected to recover somewhat after the latest stock rout, however the country’s shift from an industry-based to a service-based economy underlines downside risk in copper.

Gold hovered above 1085 level in morning Asia trade for a third day although short positions remained popular. Overnight, US existing home sales data was released at the highest level since 2007 and hinted at a recovery in the housing market that would support interest rate hike decision. The world’s biggest exchange-traded fund for gold, SPDR Gold Shares (ARCA:GLD), fell to the lowest level since 2008 on Wednesday. Looking ahead, any bullion rally up to the 5-day moving average at 1104.6 may attract more selling interests.

GOLD TECHNICAL ANALYSIS – Gold has persistently held above 1085 support level for three sessions, despite a downtrend signal from moving averages. The bears had better wait for a clean break before entering short positions. Prolonged price action in this area may lead to a consolidation, especially in the absence of fundamental drivers.
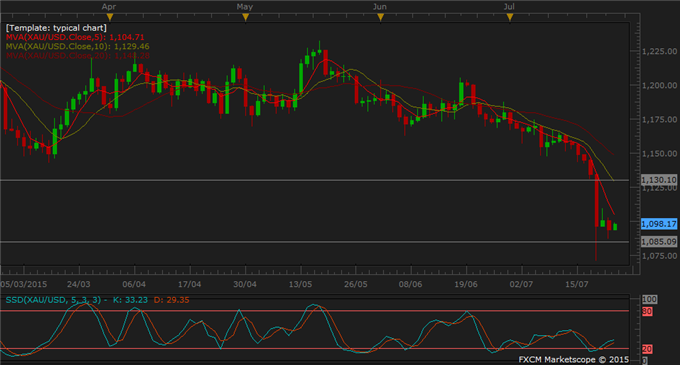
Gold Chart

COPPER TECHNICAL ANALYSIS – As downtrend signal resumed in copper prices, the bears may look to place shorts with stop loss trailing 10-day moving average at 2.495. Momentum has waned after yesterday’s sharp fall, leaving room for some short-lived recovery during the session. Intraday resistance level is found at 2.4540, the top of this newly establish range.
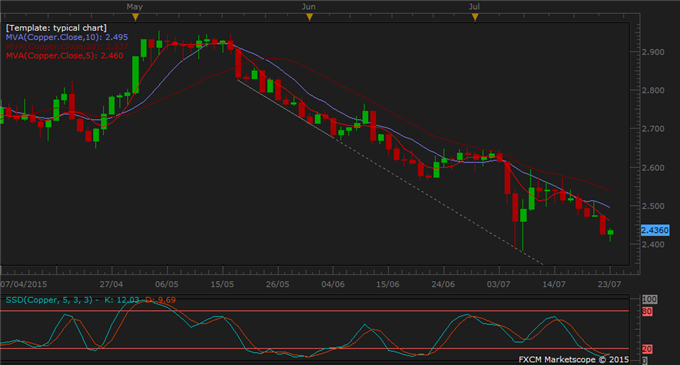
Copper Chart

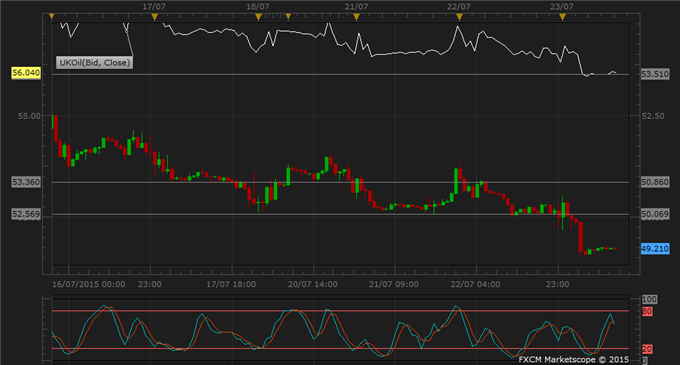
CRUDE OIL TECHNICAL ANALYSIS – WTI oil has been flat in the Asian morning after yesterday’s sharp fall below 61.8% Fibo and three-month support level at 50. Momentum is winding down today hence no big moves are expected. The next few sessions are critical to future direction, whether prices make a clean break below this level or return above head for a consolidation. The bears may find short opportunities at any rally and subsequent failure to break through 50.
3rd party Ad. Not an offer or recommendation by Investing.com. See disclosure here or remove ads .

Crude Oil Chart

Original post

Latest comments

I also remember there was a well documented visit by CNBC's Bob Pisani to GLD's gold vault. This visit was organized by GLD's management to prove the existence of GLD's gold but the gold bar held up by Mr. Pisani had the serial number ZJ6752 which did not appear on the most recent bar list at that time. It was later discovered that this 'GLD' bar was actually owned by ETF Securities.
"The world’s biggest exchange-traded fund for gold, SPDR Gold Shares (ARCA:GLD), fell to the lowest level since 2008 on Wednesday.". . I'm not surprised about paper gold GLD sinking in particular since there many red flags marring GLD. Did anyone try calling the GLD hotline in search of numerical details on GLD's insurance? The prospectus vaguely states "The Custodian maintains insurance with regard to its business on such terms and conditions as it considers appropriate which does not cover the full amount of gold held in custody." When I specifically asked for clarification on this clause and about how much of the gold was insured, the representative proceeded act as if he didn't know and said they were just the "marketing agent" for GLD. What kind of marketing agent doesn't know such basic information about a product they are marketing? It seems like they are deliberately hiding information from investors..
Risk Disclosure: Trading in financial instruments and/or cryptocurrencies involves high risks including the risk of losing some, or all, of your investment amount, and may not be suitable for all investors. Prices of cryptocurrencies are extremely volatile and may be affected by external factors such as financial, regulatory or political events. Trading on margin increases the financial risks.
Before deciding to trade in financial instrument or cryptocurrencies you should be fully informed of the risks and costs associated with trading the financial markets, carefully consider your investment objectives, level of experience, and risk appetite, and seek professional advice where needed.
Fusion Media would like to remind you that the data contained in this website is not necessarily real-time nor accurate. The data and prices on the website are not necessarily provided by any market or exchange, but may be provided by market makers, and so prices may not be accurate and may differ from the actual price at any given market, meaning prices are indicative and not appropriate for trading purposes. Fusion Media and any provider of the data contained in this website will not accept liability for any loss or damage as a result of your trading, or your reliance on the information contained within this website.
It is prohibited to use, store, reproduce, display, modify, transmit or distribute the data contained in this website without the explicit prior written permission of Fusion Media and/or the data provider. All intellectual property rights are reserved by the providers and/or the exchange providing the data contained in this website.
Fusion Media may be compensated by the advertisers that appear on the website, based on your interaction with the advertisements or advertisers.
© 2007-2024 - Fusion Media Limited. All Rights Reserved.