Get 40% Off
💰 Buffett reveals a $6.7B stake in Chubb. Copy the full portfolio for FREE with InvestingPro’s Stock Ideas toolCopy Portfolio

Crude Oil Aims To Resume Decline, SPX 500 Down Most In 6 Week

Published 03/09/2015, 05:53 AM
Updated 07/09/2023, 06:31 AM
US500
-
DX
-
CL
-

Talking Points:

  • US Dollar Continues to Soar, Sets Another 11-Year High
  • S&P 500 Issues the Largest Daily Drawdown in 6 Weeks
  • Gold Drops Most in 15 Months, Crude Oil Hints at Top

US DOLLAR TECHNICAL ANALYSIS – Prices look poised to continue higher after prices put in the largest daily advance in six weeks. Near-term resistance is at 12107, the 38.2% Fibonacci expansion, with a break above that on a daily closing basis exposing the 50% level at 12221. Alternatively, a below the 23.6% Fib at 11965 opens the door for a challenge of the 11854-76 area (14.6% Fibonacci expansion, March 2009 high).
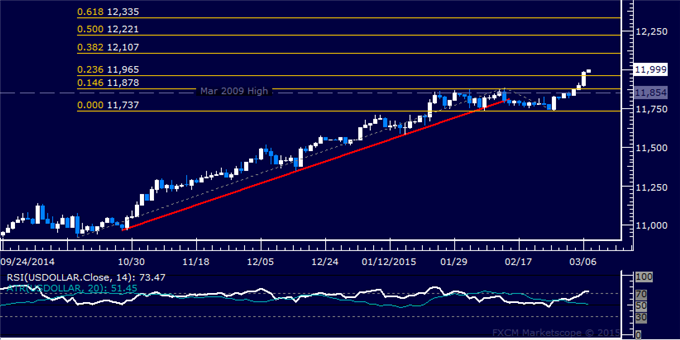
USD Chart

S&P 500 TECHNICAL ANALYSIS – Prices accelerated downward, producing the largest daily drawdown since late January. Sellers now aim to challenge the 38.2% Fibonacci retracement at 2066.00, with a break below that on a daily closing basis exposing the 50% level at 2049.50. Alternatively, a reversal back above the 23.6% Fib at 2086.40 targets range support-turned-resistance at 2101.40.
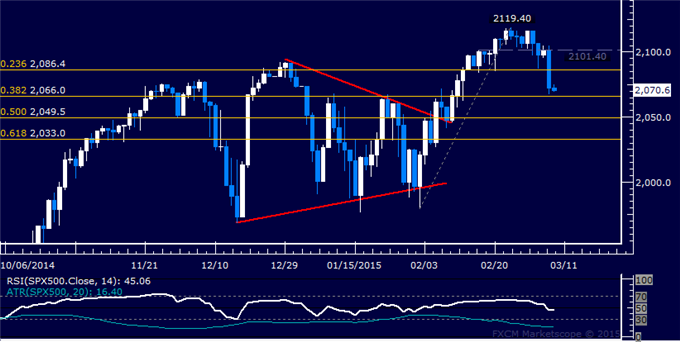
SPX Chart

GOLD TECHNICAL ANALYSIS – Prices resumed their push downward to test support at 1163.43, the 50% Fibonacci expansion. A break below this barrier exposes the 61.8% level at 1149.35. Alternatively, a rebound above the 38.2% Fib at 1177.51 targets the 23.6% expansion 1194.94.
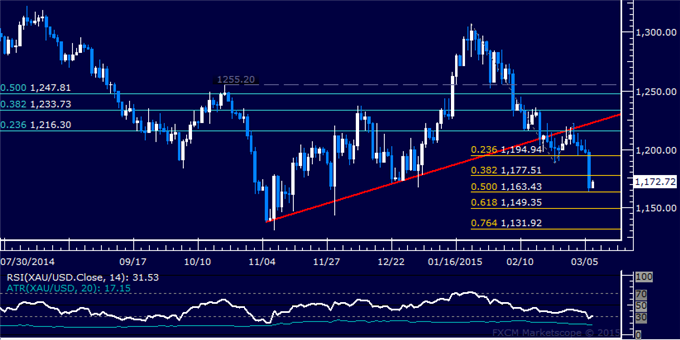
Gold Chart

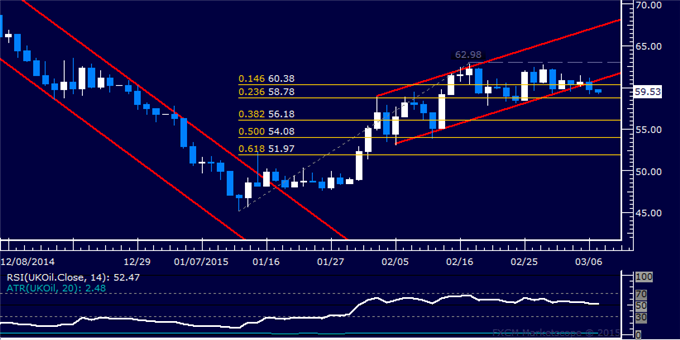
CRUDE OIL TECHNICAL ANALYSIS – Prices looks to be turning lower anew having played out a corrective recovery as expected. A break below the 23.6% Fibonacci retracement at 58.78 exposes the 38.2% level at 56.18. Alternatively, a reversal back above channel support-turned-resistance at 60.94 targets the February 17 high at 62.98.
3rd party Ad. Not an offer or recommendation by Investing.com. See disclosure here or remove ads .

Crude Oil Chart

Original post

Latest comments

Risk Disclosure: Trading in financial instruments and/or cryptocurrencies involves high risks including the risk of losing some, or all, of your investment amount, and may not be suitable for all investors. Prices of cryptocurrencies are extremely volatile and may be affected by external factors such as financial, regulatory or political events. Trading on margin increases the financial risks.
Before deciding to trade in financial instrument or cryptocurrencies you should be fully informed of the risks and costs associated with trading the financial markets, carefully consider your investment objectives, level of experience, and risk appetite, and seek professional advice where needed.
Fusion Media would like to remind you that the data contained in this website is not necessarily real-time nor accurate. The data and prices on the website are not necessarily provided by any market or exchange, but may be provided by market makers, and so prices may not be accurate and may differ from the actual price at any given market, meaning prices are indicative and not appropriate for trading purposes. Fusion Media and any provider of the data contained in this website will not accept liability for any loss or damage as a result of your trading, or your reliance on the information contained within this website.
It is prohibited to use, store, reproduce, display, modify, transmit or distribute the data contained in this website without the explicit prior written permission of Fusion Media and/or the data provider. All intellectual property rights are reserved by the providers and/or the exchange providing the data contained in this website.
Fusion Media may be compensated by the advertisers that appear on the website, based on your interaction with the advertisements or advertisers.
© 2007-2024 - Fusion Media Limited. All Rights Reserved.