Crude Inventories crush oil whilst silver may provide an early indicator of a deeper gold correction.
Oil
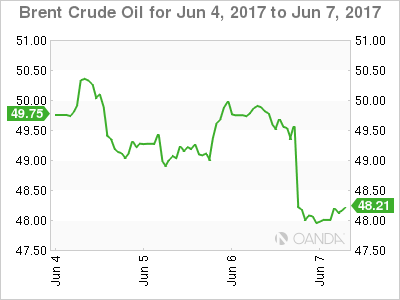
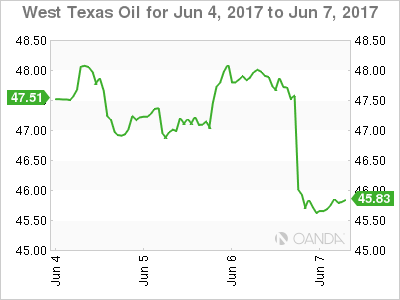
There is missing on forecasts, and there is coming in at too shallow an angle, bouncing off the atmosphere and spinning into outer space. Such was the U.S. DOE Crude Inventories overnight, coming in at a 3.3 million barrel surplus against and expected 3.5 million barrel drawdown. With such a huge miss the effect was predictable. Brent plunged -3.60% and WTI collapsed by -4.30% to end the New York session.
OPEC and Non-OPEC may well have to face some stark choices at their review in July now, as, despite intra-day volatility since rolling over their production cut, oil has now fallen nearly 12%. An unpalatable option of increasing the daily production cut target may have to be seriously put onto the table instead of being talked about in sound bites.
Brent spot trades slightly higher at 48.25 in early Asia on short-term profit taking. It has resistance at 48.75 and then 50.00. It has support initially at 47.75 with a break of this level opening up the May lows of 46.30.

WTI spot is trading at 45.90 in early Asia. Resistance is at 46.50 initially and then 48.00. Support appears just below current levels at 45.50 with a break of this level opening a retest of the May panic liquidation lows at 43.50.

Precious Metals
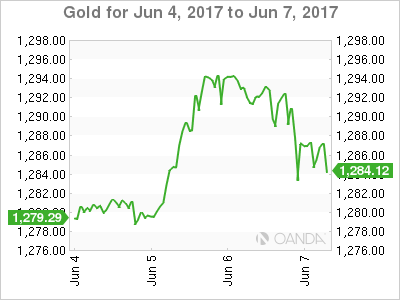
Gold gave back some of its previous day’s gains overnight, falling -0.50% to close around 1286.75 in New York. An easing of political tensions with Comey’s first testimony published ahead of the first hearing, and the Saudi’s allowing food and medicine shipments to Qatar across their land border may have played a part. The double top at 1296 could have initiated technical based traders to engage in some profit-taking as well.
At these levels, gold may already have a lot of today’s event risk built into its price. Especially as the last poll ahead of the U.K Election from YOUGOV suggests, the Conservative’s lead has widened just ahead of the polls themselves. That said, with the results coming out during the Asian session tomorrow morning, the downside for gold is likely to be limited as we run into the weekend even if the 1296/1300 region appears to be quite formidable resistance for now.
Gold has support around 1282 and then 1279 with a break of the latter implying a potential technical move to the 1260 region, especially if the election passes without drama.

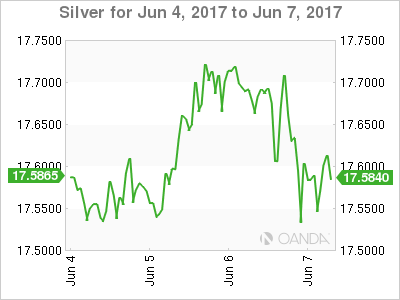
Traders may well want to take their cue from Silver in fact, which is hovering at 17.6000 this morning, just above it’s 100 and 200-day moving averages at 17.5550 and 17.5200. A break of 17.5000 implies a much deeper correction for silver and may signal a correction lower in gold as well.

