Get 40% Off
👀 👁 🧿 All eyes on Biogen, up +4,56% after posting earnings. Our AI picked it in March 2024.
Which stocks will surge next?
Unlock AI-picked Stocks

CRB Index Now Testing Key Level

Published 05/04/2015, 06:25 AM
Updated 07/09/2023, 06:31 AM

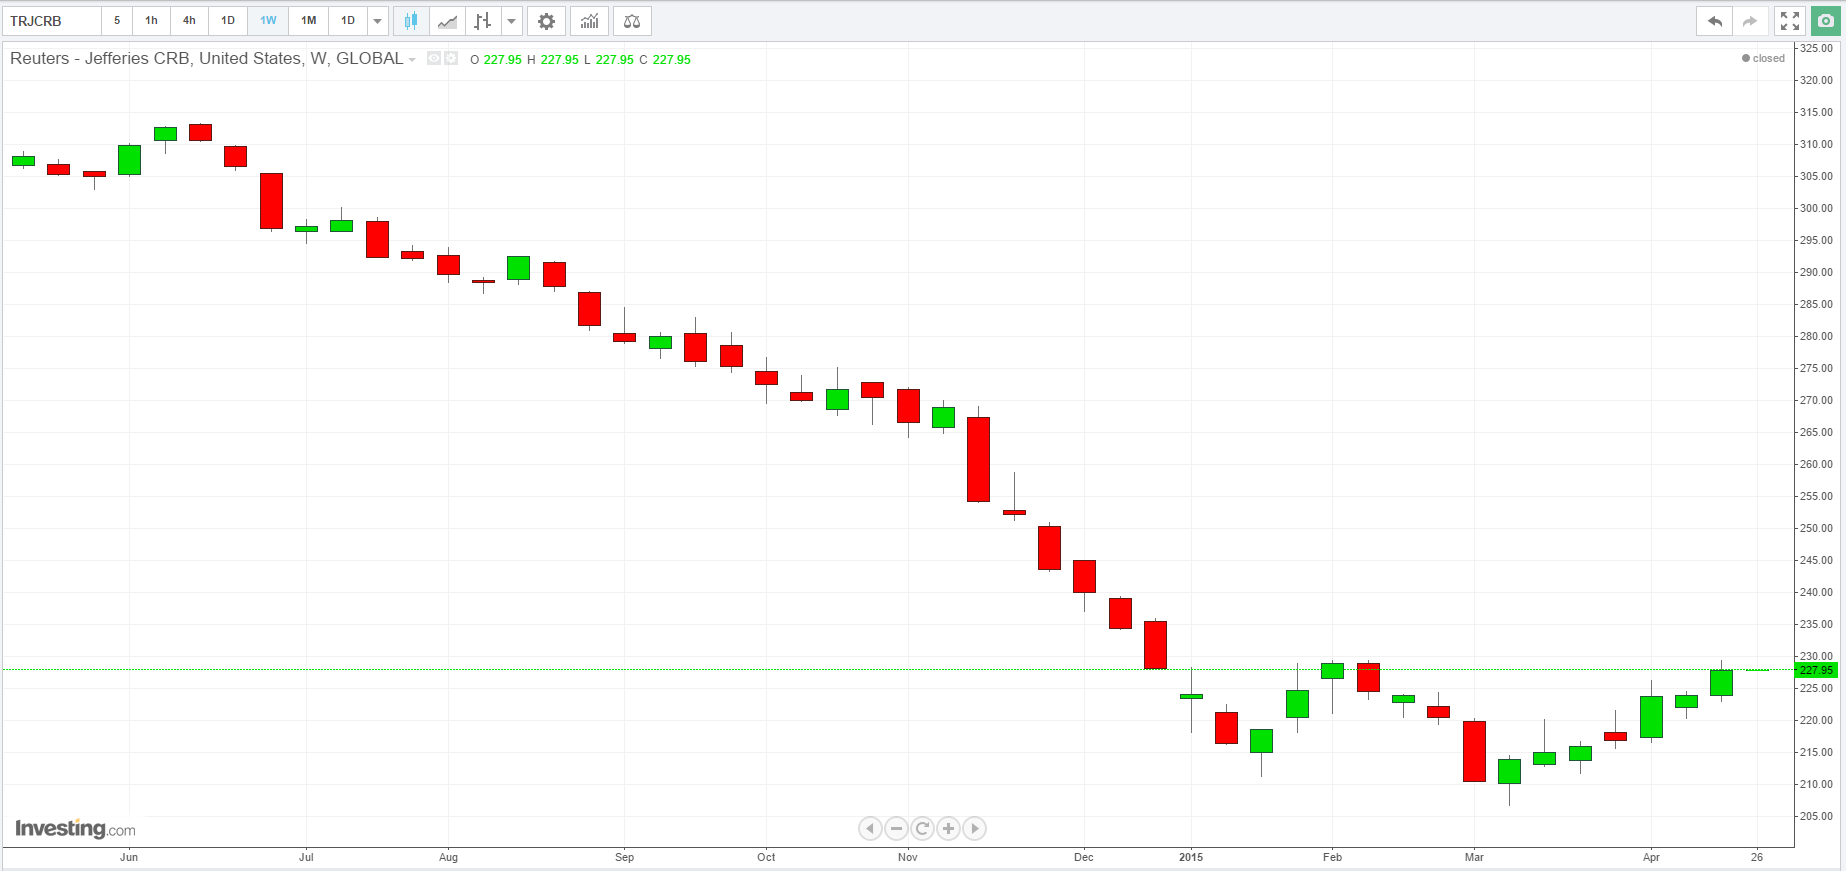
CRB index - weekly chart

For commodities, and in particular some of the ‘premier league’ stars such as oil and copper, the last twelve months have seen sustained falls with prices moving ever lower on increasing momentum. This long term trend is neatly encapsulated on the weekly chart for the Jeffries CRB Commodity Index, starting before the new year and finally signalling a pause point and potential bottom within the past two months.

This journey south for the CRB saw the index fall from the high of 313.18 in June 2014 to a low of 206.81 in early March this year, before rallying to close last week at 227.95 as it now prepares to test the 230 region once again. This is a key level and one that saw a failure in early February with a consequent breakdown in the bullish rally. For any continuation of the current bullish momentum for base commodity prices—in particular oil and copper—this level must now be breached. This break will then provide the platform for the next leg for a further move higher.

Whilst not strictly a double bottom on this time frame, the index is certainly building a base at this level. However, should the index fail to break above the 230 region, then we may see a further phase of price congestion at this level, and as always, once we begin a phase of sideways price action, the trend will follow and it is simply a question of time and patience. This bullish momentum has also been reflected in some of the primary mining and related stocks with several such as Rio Tinto (NYSE:RIO), Bhp Billiton (NYSE:BBL) and Freeport-McMoran (NYSE:FCX) all now looking bullish on the longer term time frames.

3rd party Ad. Not an offer or recommendation by Investing.com. See disclosure here or remove ads .

Latest comments

Risk Disclosure: Trading in financial instruments and/or cryptocurrencies involves high risks including the risk of losing some, or all, of your investment amount, and may not be suitable for all investors. Prices of cryptocurrencies are extremely volatile and may be affected by external factors such as financial, regulatory or political events. Trading on margin increases the financial risks.
Before deciding to trade in financial instrument or cryptocurrencies you should be fully informed of the risks and costs associated with trading the financial markets, carefully consider your investment objectives, level of experience, and risk appetite, and seek professional advice where needed.
Fusion Media would like to remind you that the data contained in this website is not necessarily real-time nor accurate. The data and prices on the website are not necessarily provided by any market or exchange, but may be provided by market makers, and so prices may not be accurate and may differ from the actual price at any given market, meaning prices are indicative and not appropriate for trading purposes. Fusion Media and any provider of the data contained in this website will not accept liability for any loss or damage as a result of your trading, or your reliance on the information contained within this website.
It is prohibited to use, store, reproduce, display, modify, transmit or distribute the data contained in this website without the explicit prior written permission of Fusion Media and/or the data provider. All intellectual property rights are reserved by the providers and/or the exchange providing the data contained in this website.
Fusion Media may be compensated by the advertisers that appear on the website, based on your interaction with the advertisements or advertisers.
© 2007-2024 - Fusion Media Limited. All Rights Reserved.