
Crane Co. (NYSE:CR) reported better-than-expected results for the fourth quarter of 2019. Its earnings and sales surpassed estimates by 0.6% and 3.2%, respectively. The earnings beat marks an improvement over a negative surprise of 9.68% in the previous quarter.
Adjusted earnings in the reported quarter were $1.58 per share, surpassing the Zacks Consensus Estimate of $1.57. On a year-over-year basis, the bottom line declined 3.7% from the year-ago quarter figure of $1.64 due to poor sales performance.
For 2019, the company’s adjusted earnings were $6.02 per share, surpassing the Zacks Consensus Estimate of $6.01. On a year-over-year basis, the bottom line increased 0.5%.
Revenues Decline Y/Y
In the quarter under review, Crane’s net sales were $837.5 million, reflecting a decline of 0.3% from the year-ago quarter. Results were adversely impacted by forex woes of $4 million, offset by rise in core sales of $2 million.
However, Crane’s net sales surpassed the Zacks Consensus Estimate of $811.9 million.
The company reports net sales under four segments — Fluid Handling, Payment & Merchandising Technologies, Aerospace & Electronics, and Engineered Materials. The segmental information is briefly discussed below:
Revenues from the Fluid Handling segment were $277 million, reflecting a decline of 1% from the year-ago quarter figure. Results were adversely impacted by forex woes and organic sales decline. The segment’s order backlog was $267 million in the reported quarter, reflecting a sequential decline of 1.9%.
Revenues from Payment & Merchandising Technologies totaled $314.6 million, increasing 0.6% year over year. Organic sales in the quarter grew 2%, while forex woes had an adverse impact of 1%. Order backlog at the end of the reported quarter was $311.4 million, up 6.7% sequentially.
Revenues from the Aerospace & Electronics segment were $202.5 million, rising 3.1% year over year. The improvement was mainly driven by core sales growth. Order backlog at the end of the quarter under review was $567.4 million, up 0.5% sequentially.
Revenues from the Engineered Materials segment dipped 14.4% year over year to $43.4 million on weak business in the recreational vehicle end market. Order backlog at the end of the reported quarter was $9.4 million, down 6.9% sequentially.
For 2019, the company’s net sales were $3,283.1 million, down 1.9% year over year. However, the top line lagged the Zacks Consensus Estimate of $3.26 billion.
Operating Margin Increases Y/Y
In the fourth quarter, Crane’s cost of sales increased 45.9% year over year to $794.6 million. It represented 94.9% of net sales compared with 64.9% in the year-ago quarter. Selling, general and administrative expenses grew 4.3% year over year to $178.3 million. It represented 21.3% of net sales versus 20.4% in the year-ago quarter.
Adjusted operating income in the quarter under review increased 2.9% year over year to $128.1 million. Moreover, adjusted operating margin grew 50 basis points to 15.3%.
Balance Sheet and Cash Flow
Exiting the fourth quarter, Crane had cash and cash equivalents of $393.9 million, up 1.3% from $388.8 million at the end of the last reported quarter. Long-term debt balance was down 9.9% sequentially to $842 million.
In the fourth quarter, the company generated net cash of $222.9 million from operating activities, suggesting growth of 16.5% from the year-ago quarter. Capital expenditure was $17.9 million, down 46.1% year over year. Free cash flow in the quarter was $205 million versus $158.2 million in the year-ago quarter.
Shareholder-Friendly Policy
In the fourth quarter, Crane used $23.1 million for paying dividends, with $20.8 million distributed in the year-ago comparable quarter. Also, $79.9 million worth shares were reacquired by the company in the quarter.
Concurrent with the earnings release, it announced that its board of directors approved a 10% hike in its quarterly dividend rate. The new dividend rate is 43 cents per share, up from the previous rate of 39 cents. The company will pay out the dividend on Mar 11 to shareholders of record as of Feb 28, 2020.
Acquisitions & Others
On December 31, 2019, Crane acquired Cummins (NYSE:CMI) Allison, adding more value to its Crane Payment Innovations (CPI) business. The transaction was worth $160 million.
In the same month, Crane agreed to buy the Instrumentation & Sampling business of CIRCOR International, Inc. (NYSE:CIR) . The transaction has been valued at $172 million. The acquisition is anticipated to boost Crane’s process valve business. The buyout is anticipated to be completed in the first quarter of 2020.
Crane anticipates the two acquisitions to boost earnings by 15 cents per share in 2020 and by 25 cents by 2022.
Beside the aforementioned actions, the company commenced proactive repositioning actions for Fluid Handling. These actions are predicted to yield savings of $10 million in 2022.
Outlook
For 2020, Crane anticipates adjusted earnings per share of $6.20-$6.50. Sales are predicted to be $3.5 billion. Acquired assets will likely benefit sales by 8%, while forex woes will adversely impact sales by 0.5-1%. Core sales are expected to decline slightly.
For Fluid Handling, Crane predicts subdued end-market environment and margin expansion in 2020. Organic growth will likely be positive and margin will probably increase for Payment & Merchandising Technologies. The segment will likely face lower demand from the U.S. government at Crane Currency, while acquisition of Cummins Allison might initially adversely impact margins. For Aerospace & Electronics, the company expects headwinds from stalled production of 737-MAX to impact performance.
It anticipates operating cash flow of $405-$435 million and capital expenditure of $75 million for 2020. Free cash flow is projected to be $330-$360 million.
Crane Company Price, Consensus and EPS Surprise
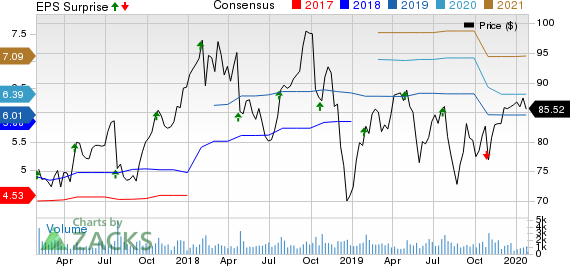
Crane Company price-consensus-eps-surprise-chart | Crane Company Quote
Zacks Rank & Other Key Picks
With a market capitalization of $5.1 billion, Crane currently carries a Zacks Rank #2 (Buy).
Two other top-ranked stocks are DXP Enterprises, Inc. (NASDAQ:DXPE) and Barnes Group, Inc. (NYSE:B) . While DXP Enterprises sports a Zacks Rank #1 (Strong Buy), Barnes carries a Zacks Rank #2. You can see the complete list of today’s Zacks #1 Rank stocks here.
In the past 60 days, earnings estimates for both companies have improved for the current year. Further, earnings surprise for the last four quarters, on average, was 17.67% for DXP Enterprises and 4.21% for Barnes.
5 Stocks Set to Double
Each was hand-picked by a Zacks expert as the #1 favorite stock to gain +100% or more in 2020. Each comes from a different sector and has unique qualities and catalysts that could fuel exceptional growth.
Most of the stocks in this report are flying under Wall Street radar, which provides a great opportunity to get in on the ground floor.
Today, See These 5 Potential Home Runs >>
Crane Company (CR): Free Stock Analysis Report
DXP Enterprises, Inc. (DXPE): Free Stock Analysis Report
Barnes Group, Inc. (B): Free Stock Analysis Report
CIRCOR International, Inc. (CIR): Free Stock Analysis Report
Original post
Zacks Investment Research