
Here are the latest charts and statistics for the Commitment of Traders (COT) data published by the Commodities Futures Trading Commission (CFTC).
The latest COT data is updated through Tuesday, Jan. 25, and shows a quick view of how large traders (for-profit speculators and commercial entities) were positioned in the futures markets.
Highlighting the COT bonds data is the continued improvement in the United States 5-Year Bond speculator positions. Speculative positioning in the 5-Year has seen bearish bets sharply falling for the third consecutive week and by a total of 262,418 contracts over that time frame.
This improvement in the 5-Year brings the net speculator standing to the least bearish level in nineteen weeks, dating back to Sept. 14 when the spec standing was -24,366 contracts.
Joining the 5-Year (76,717 contracts) in gaining this week were the United States 2-Year Bond (-6,759 contracts), United States 10-Year (6,786 contracts), Ultra 10-Year U.S. Treasury Note Futures (18,302 contracts) and the Fed Funds (61,711 contracts) while decreasing bets for the week were seen in Ultra US Bond (-4,895 contracts), Long US Bond (-16,599 contracts) and the Eurodollar Futures (-294,011 contracts).
2-Year Treasury Note Futures

The 2-Year Treasury Note large speculator standing this week came in at a net position of 31,877 contracts in the data reported through Tuesday. This was a weekly reduction of -6,759 contracts from the previous week which had a total of 38,636 net contracts.
This week’s current strength score (the trader positioning range over the past three years, measured from 0 to 100) shows the speculators are currently Bullish-Extreme with a score of 88.7 percent. The commercials are Bearish with a score of 27.0 percent and the small traders (not shown in chart) are Bearish-Extreme with a score of 3.5 percent.
5-Year Treasury Note Futures

The 5-Year Treasury Note large speculator standing this week came in at a net position of -140,457 contracts in the data reported through Tuesday. This was a weekly boost of 76,717 contracts from the previous week which had a total of -217,174 net contracts.
This week’s current strength score (the trader positioning range over the past three years, measured from 0 to 100) shows the speculators are currently Bullish with a score of 57.0 percent. The commercials are Bullish with a score of 66.3 percent and the small traders (not shown in chart) are Bearish-Extreme with a score of 9.4 percent.
10-Year Treasury Note Futures
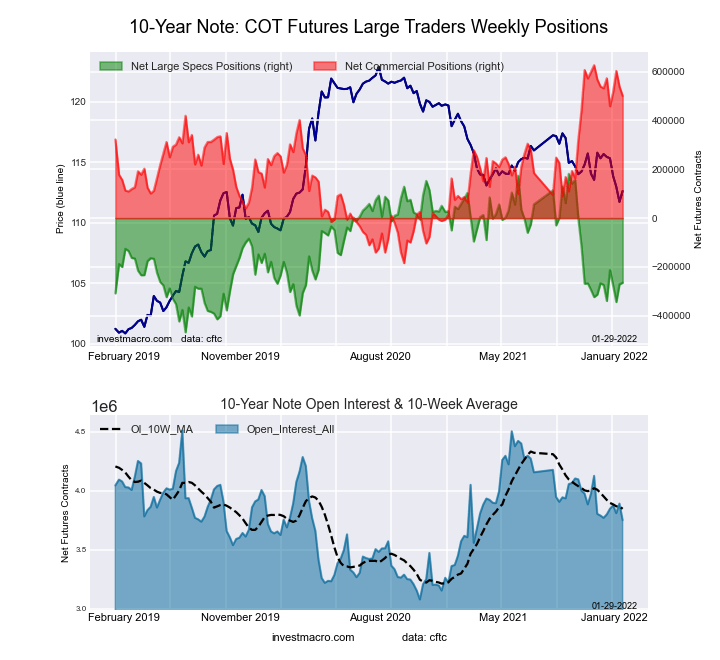
The 10-Year Treasury Note large speculator standing this week came in at a net position of -264,656 contracts in the data reported through Tuesday. This was a weekly gain of 6,786 contracts from the previous week which had a total of -271,442 net contracts.
This week’s current strength score (the trader positioning range over the past three years, measured from 0 to 100) shows the speculators are currently Bearish with a score of 31.3 percent. The commercials are Bullish-Extreme with a score of 84.5 percent and the small traders (not shown in chart) are Bearish with a score of 23.7 percent.
Ultra 10-Year Notes Futures

The Ultra 10-Year Notes large speculator standing this week came in at a net position of 94,332 contracts in the data reported through Tuesday. This was a weekly rise of 18,302 contracts from the previous week which had a total of 76,030 net contracts.
This week’s current strength score (the trader positioning range over the past three years, measured from 0 to 100) shows the speculators are currently Bullish with a score of 52.7 percent. The commercials are Bullish with a score of 67.4 percent and the small traders (not shown in chart) are Bearish-Extreme with a score of 9.2 percent.
US Treasury Bonds Futures
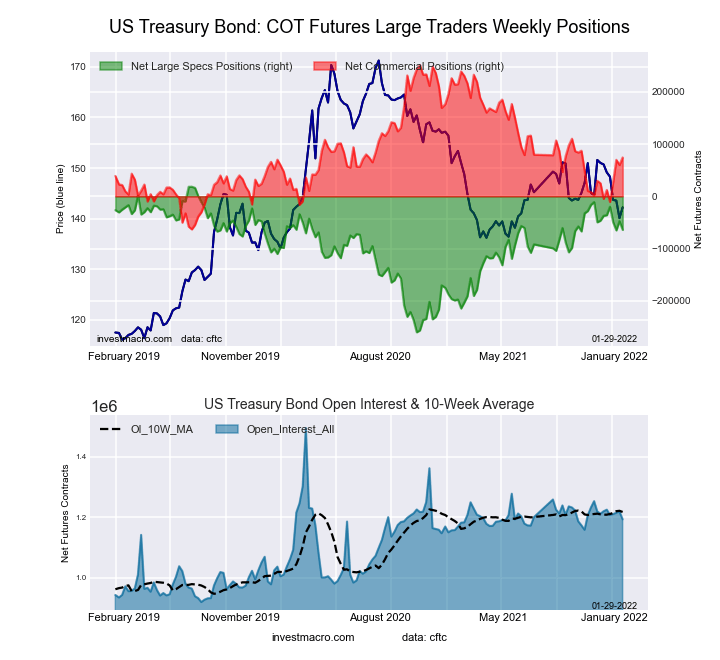
The US Treasury Bonds large speculator standing this week came in at a net position of -64,095 contracts in the data reported through Tuesday. This was a weekly fall of -16,599 contracts from the previous week which had a total of -47,496 net contracts.
This week’s current strength score (the trader positioning range over the past three years, measured from 0 to 100) shows the speculators are currently Bullish with a score of 70.4 percent. The commercials are Bearish with a score of 43.8 percent and the small traders (not shown in chart) are Bearish with a score of 44.5 percent.
Ultra US Treasury Bonds Futures

The Ultra U.S. Treasury Bond Futures large speculator standing this week came in at a net position of -343,245 contracts in the data reported through Tuesday. This was a weekly lowering of -4,895 contracts from the previous week which had a total of -338,350 net contracts.
This week’s current strength score (the trader positioning range over the past three years, measured from 0 to 100) shows the speculators are currently Bearish with a score of 45.2 percent. The commercials are Bullish with a score of 67.8 percent and the small traders (not shown in chart) are Bullish with a score of 50.5 percent.