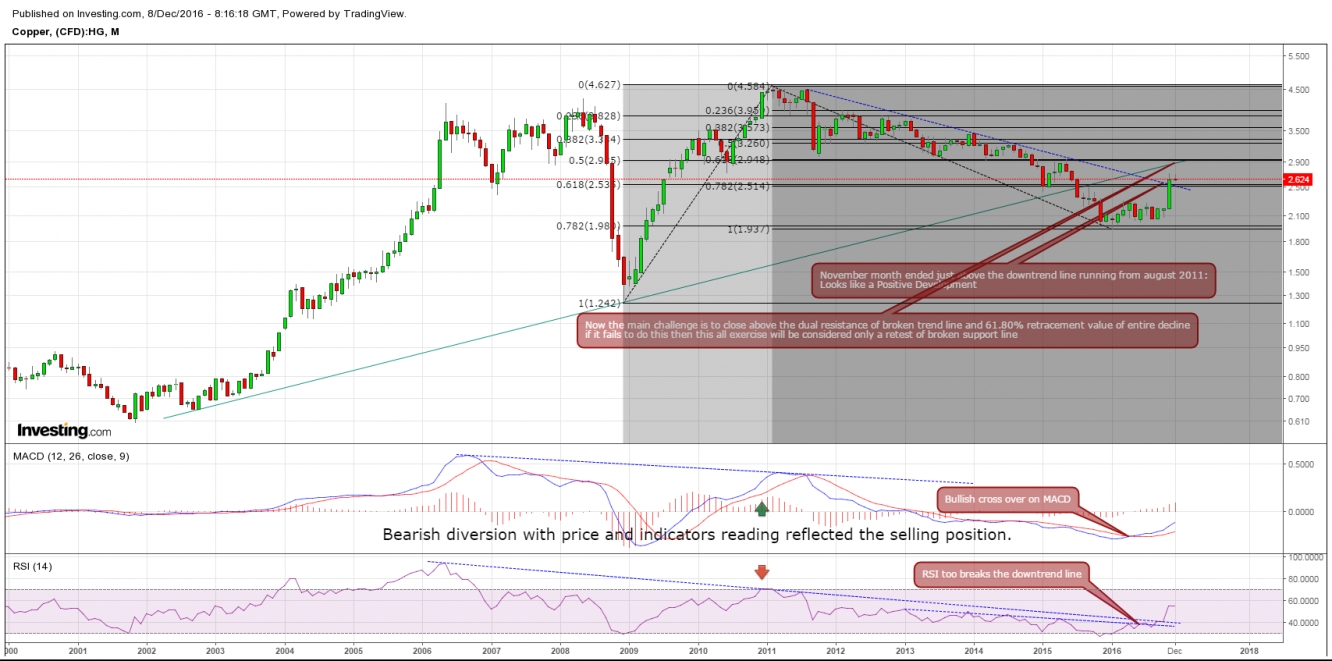
We witnessed a huge bull run in base metals between November 2001 and May 2008 (of course the leader was copper on that bull market). Copper printed huge gains as it started from 0.604 cents and reached to a high of 4.270 cents (i.e. more than 7 times its market value in 7 yrs) and then we met with the collapse of USD, which induced panic in world markets and set the tone for the Recession. In this period, copper shed approximately 82% of its 7 yr gains in a mere 7 months in 2008 and printed a low 1.205 on 1/12/2008 after a high of 4.270 in May 2008.
After the collapse, the Fed started quantitative easing to support growth by printing enormous fiat currency to promote growth. It worked, and copper again started to rise and printed its new lifetime high of 4.625 in February 2011. Since then, copper is rolling down and it breaks the important trend-line (July of 2015) in this period which supported it from 2001.
Here is the monthly chart reflecting these cycles with its rising trend line since 2001.
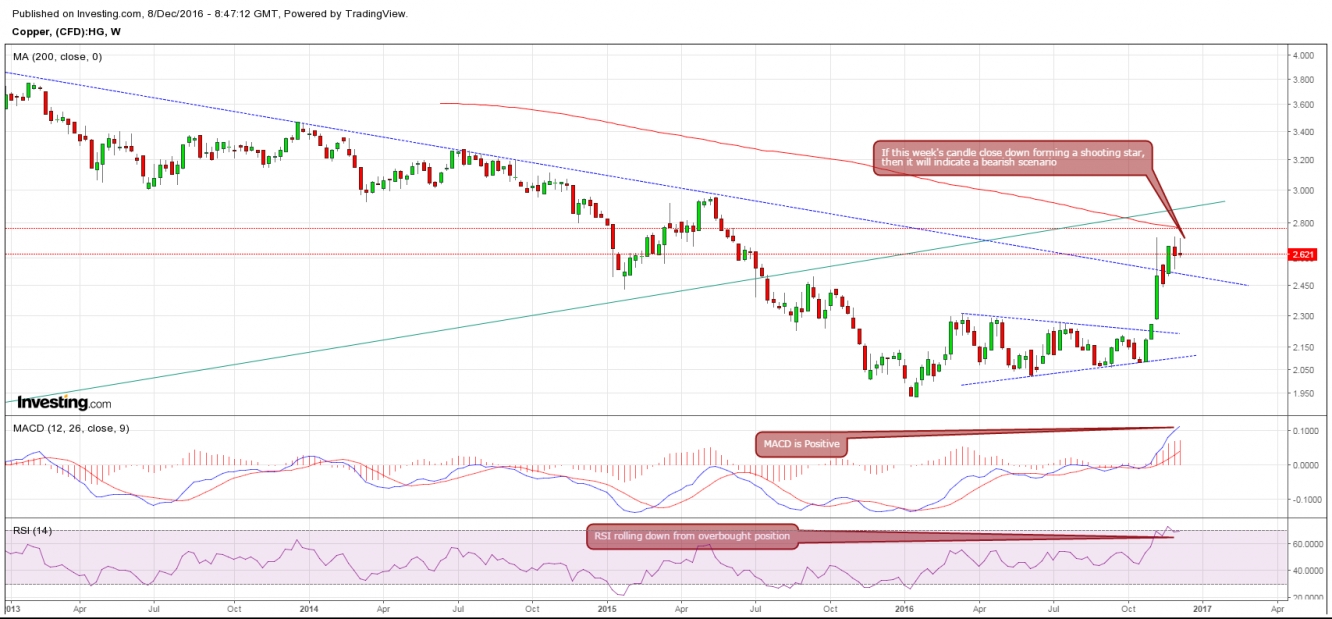
The dilemma: the sudden rise in copper this month is nothing special, as I was expecting this to happen as a throw over from the triangle pattern developed on the weekly chart. This prompted me to go long from the 2.08 levels in anticipation of approaching the broken trend-line and 200 WMA, which currently sits around 2.77. If copper manages to close either above 2.77 on a weekly basis, the hopes for a trend reversal will revive and then close above the rising line with huge volume to confirm it. RSI and MACD on the monthly and weekly charts already flashed a buy signal.
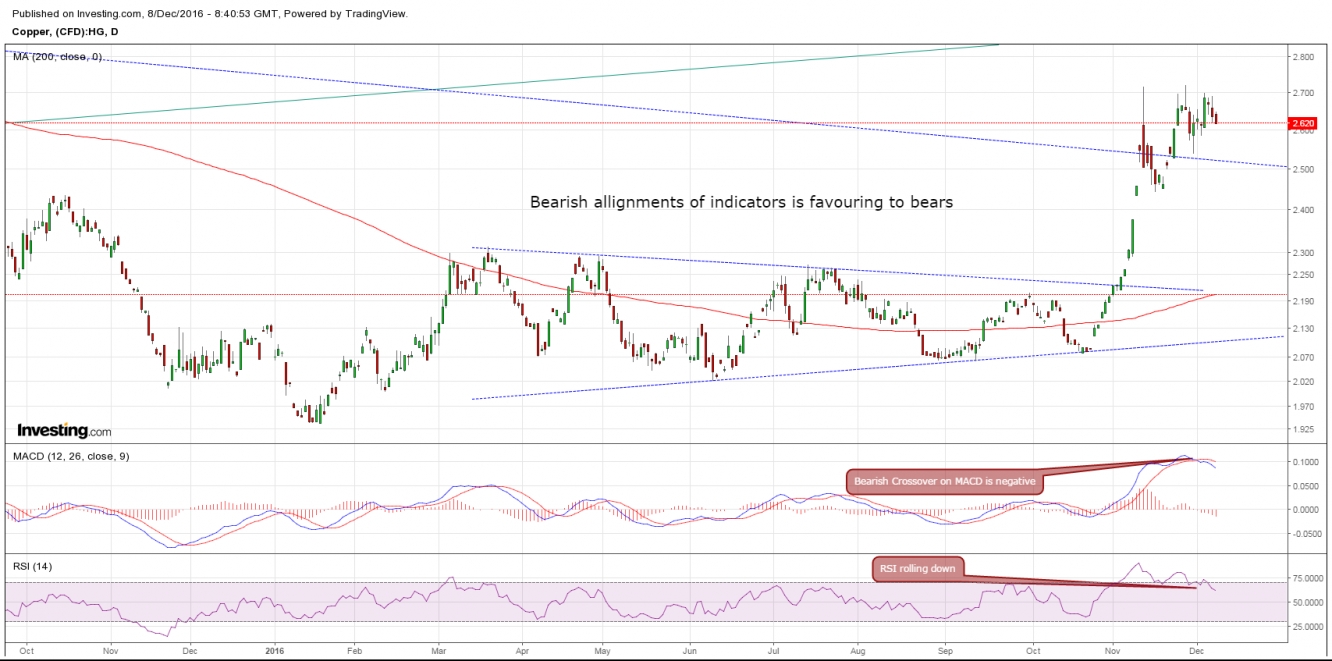
Lets move towards the daily chart.
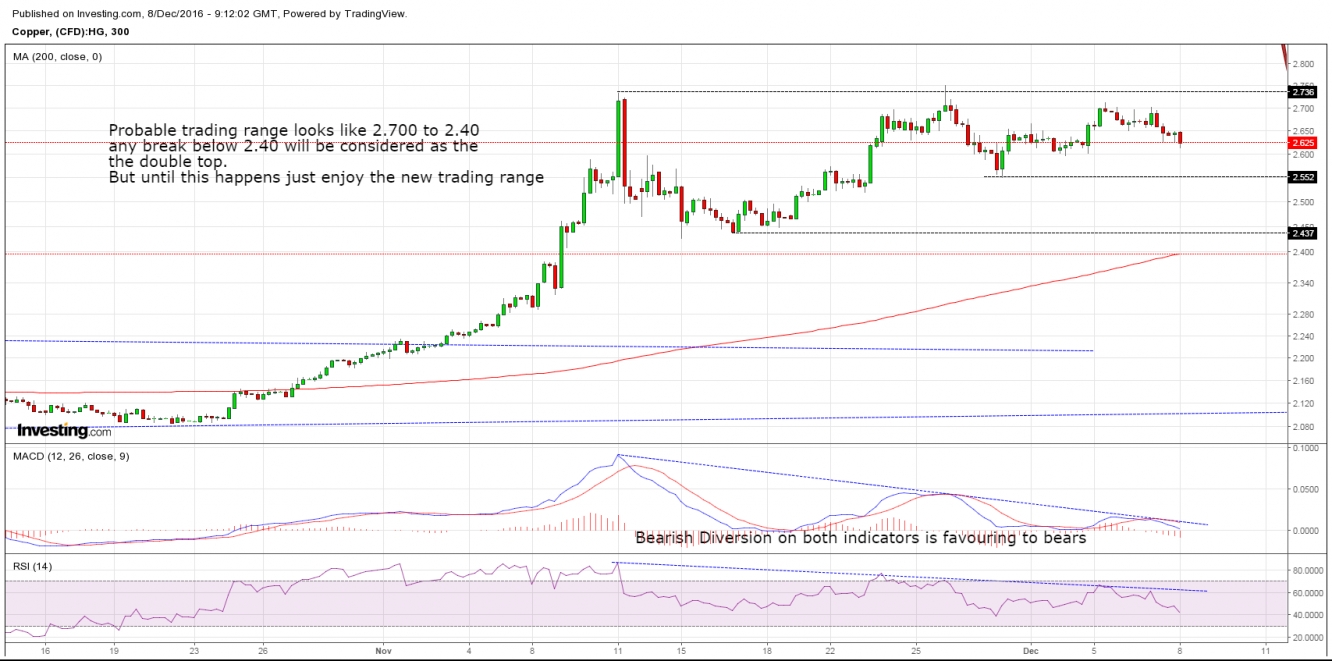
Daily chart is in favour of bears right now. The correction seems likely after a possible double top formation around 2.722. Lets move towards a 5 hour chart for more insight into this double top formation.
As I always say, any pattern is not of any worth until it gives a break in the desired direction, and the same is true here. Copper failed to print another high and rolled back towards support now. If support fails to offer the stability and it rolls down below 2.40 to close a day, then this probable double top will definitely come under consideration. I am with bears right now until it gives a close above 2.77
Resistance: 2.645 / 2.700 / 2.770
Support: 2.560 / 2.50 / 2.400


