Talking Points
- Crude Oil Surges Above $97.50 Following Bullish Inventories Figures
- Gold Swings Higher As US Data May Suggest Less-Aggressive “Taper” Timeline
- Precious Metals Could Weaken Ahead of Upcoming FOMC Meeting
Gold soared above the $1,260 level as a disappointing US PMI reading may have tempered Fed “taper” bets, sparking renewed demand for the yellow metal. However, Crude oil shrugged off the discouraging US economic data as a bullish weekly inventories report sent WTI above $97.50, for the fourth straight day of gains.
The Energy Information Agency (EIA) report revealed that crude stockpiles grew by 990,000 barrels for the week, which was slower than the build of 1.15 million anticipated by analysts. Newswires have reported this may have been due to a swell in heating demand, as frigid weather conditions continue to grip the East Coast.
A light economic docket in the session ahead may leave Gold and Oil wanting for a fresh catalyst to spur on additional gains. This may result in some consolidation ahead of the weekend. Yet, trading activity is likely to be reignited next week in the lead up to the FOMC Meeting set to take place on Wednesday. Economists are currently expecting the central bank to continue cuts to their QE program, which may put selling pressure on the precious metals in the near-term.
CRUDE OIL TECHNICAL ANALYSIS:
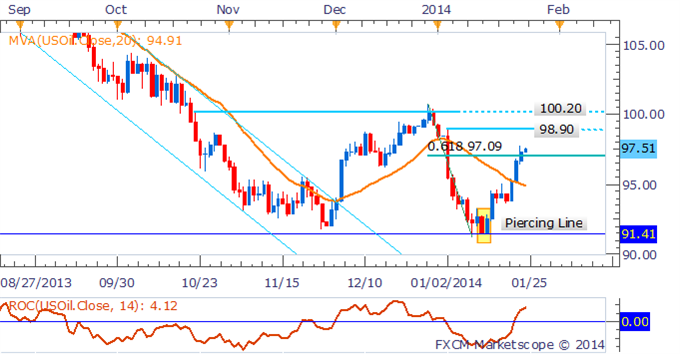
The 61.8% Fib Retracement Level is suggesting some support around the psychologically significant $97 handle, while resistance looms ahead at 98.80 (the yearly high). A short-term uptrend as signaled by gaining upside momentum on the rate of change indicator, as well as prices being above the 20 SMA, favors the upside.

GOLD TECHNICAL ANALYSIS:
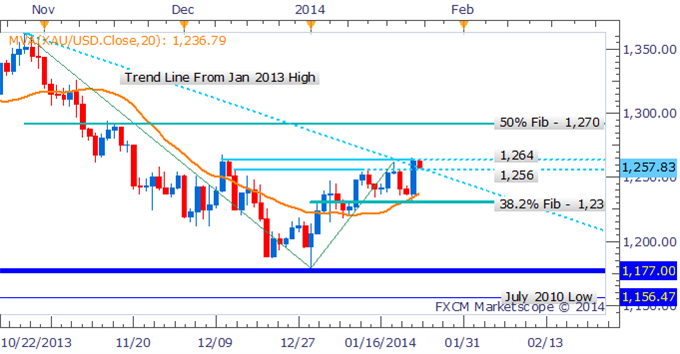
The 38.2% Fib Retracement Level and 20 SMA provided a launching pad for gold as buyers moved in and swung prices above previous resistance (now support) at $1,256. A break above the December 2013 high at $1,264 would open up the $1,270 level.

SILVER TECHNICAL ANALYSIS:
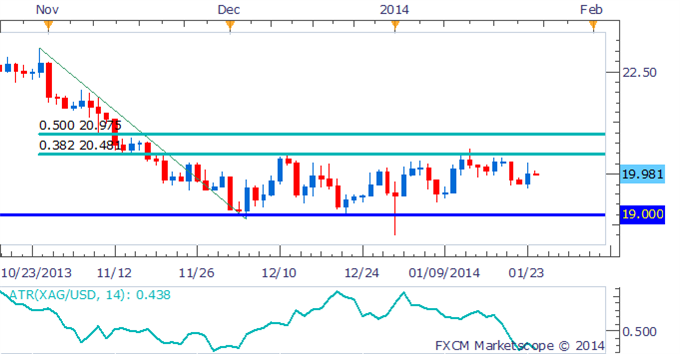
Silver’s price action remains muted compared with its bigger brother, gold. Upside resistance remains at $20.48, while buying support is sitting at $19. With volatility near multi-year lows, range-trading remains preferred.

COPPER TECHNICAL ANALYSIS:
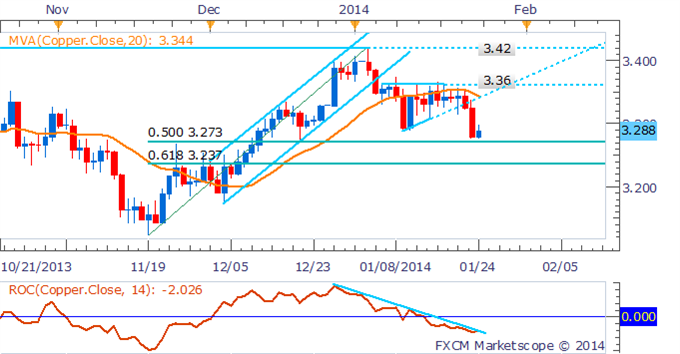
Copper has found some buying support at $3.273 following the break below an ascending triangle pattern. A move below the 50% Fib Retracement Level would open up the $3.237 level.

