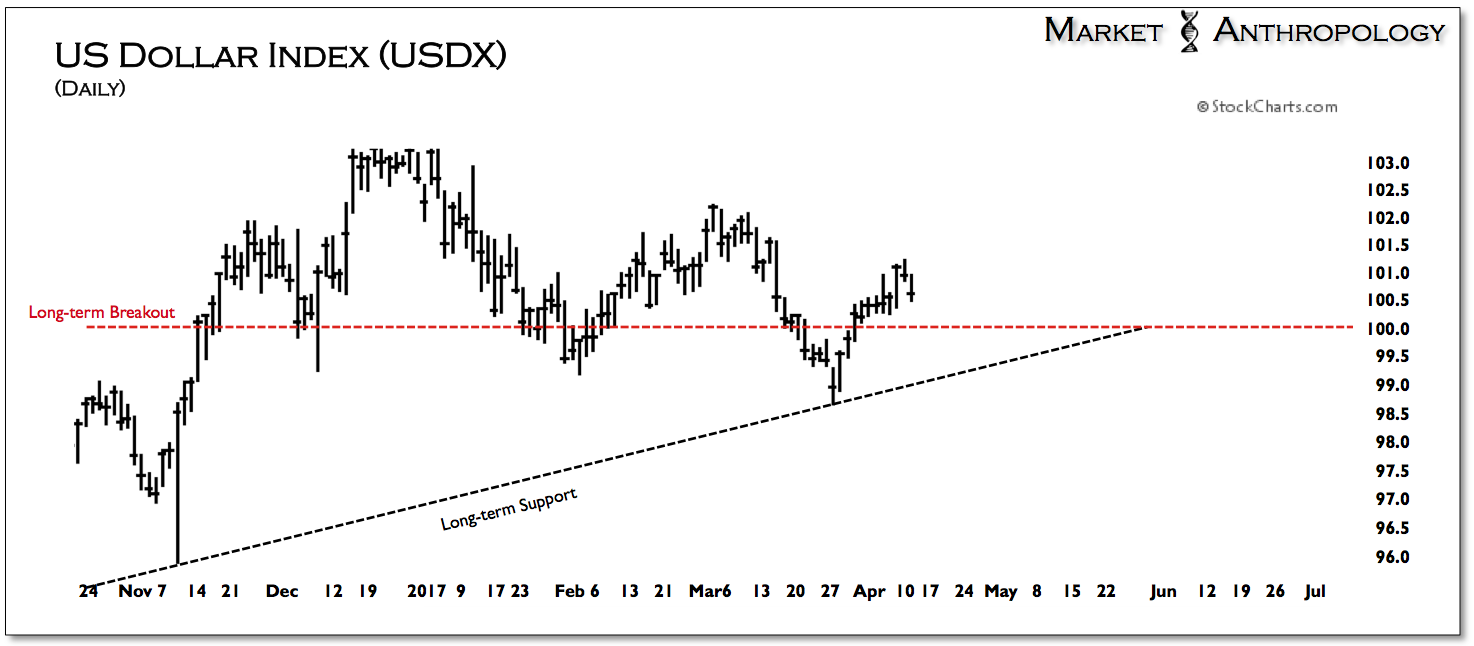
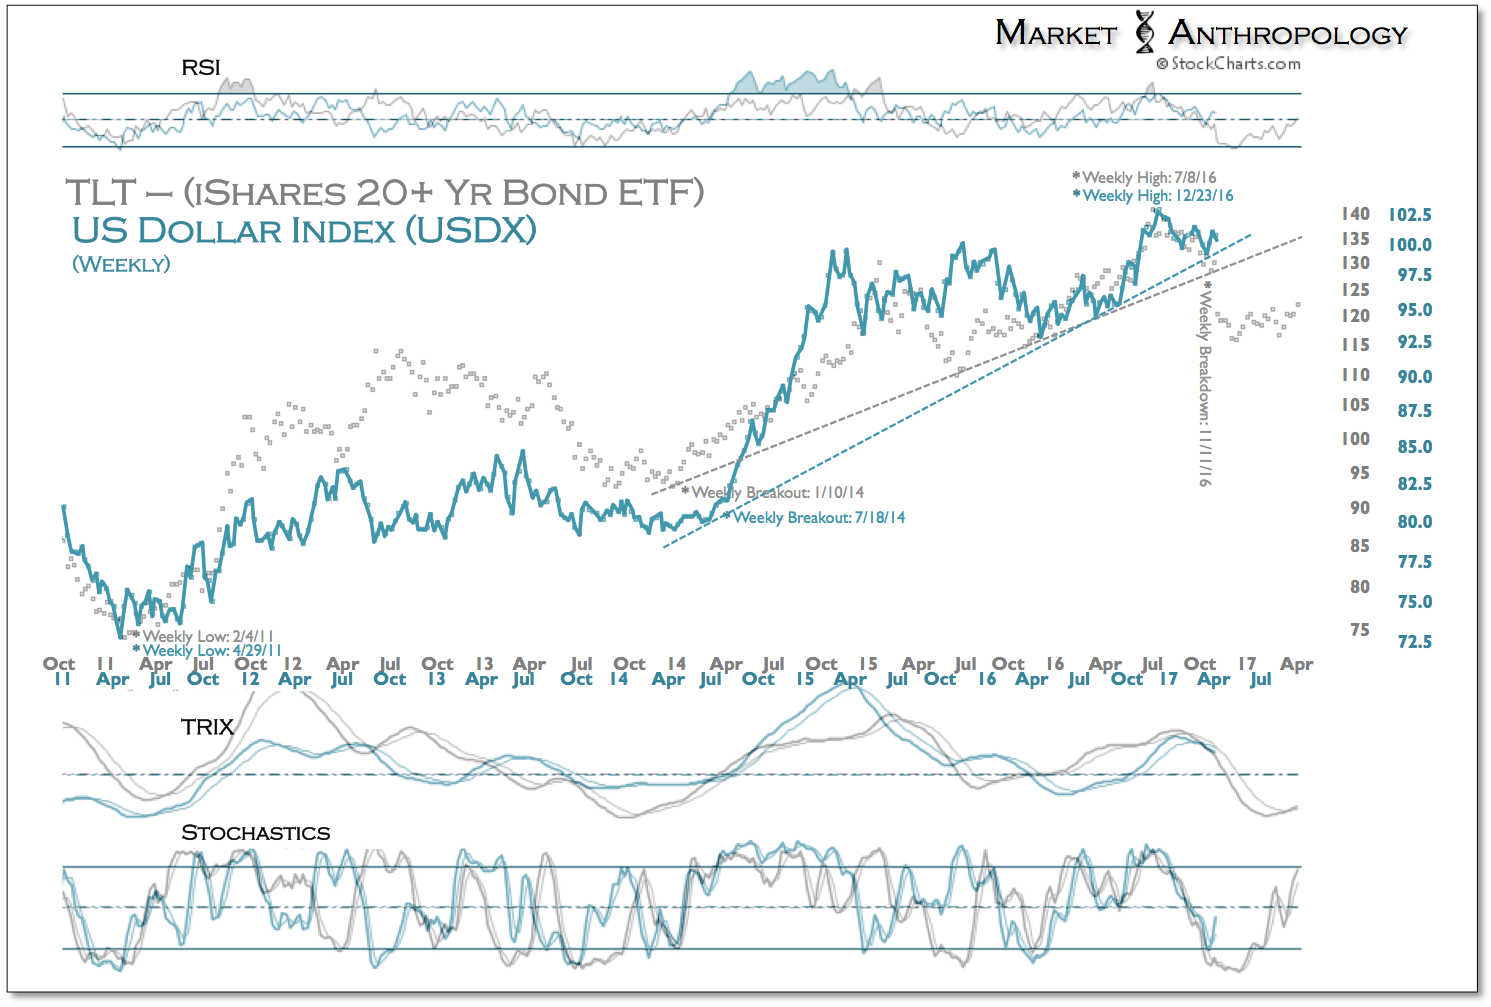
Headed into what we anticipate will bring some fireworks to the currency markets this month, the US dollar index has again turned down modestly in the front half of this week. Currently trading behind a series of lower highs and lows from this past December’s cycle peak, our expectations remain for a breakdown below the index’s long-term uptrend, extending from the July 2014 breakout.
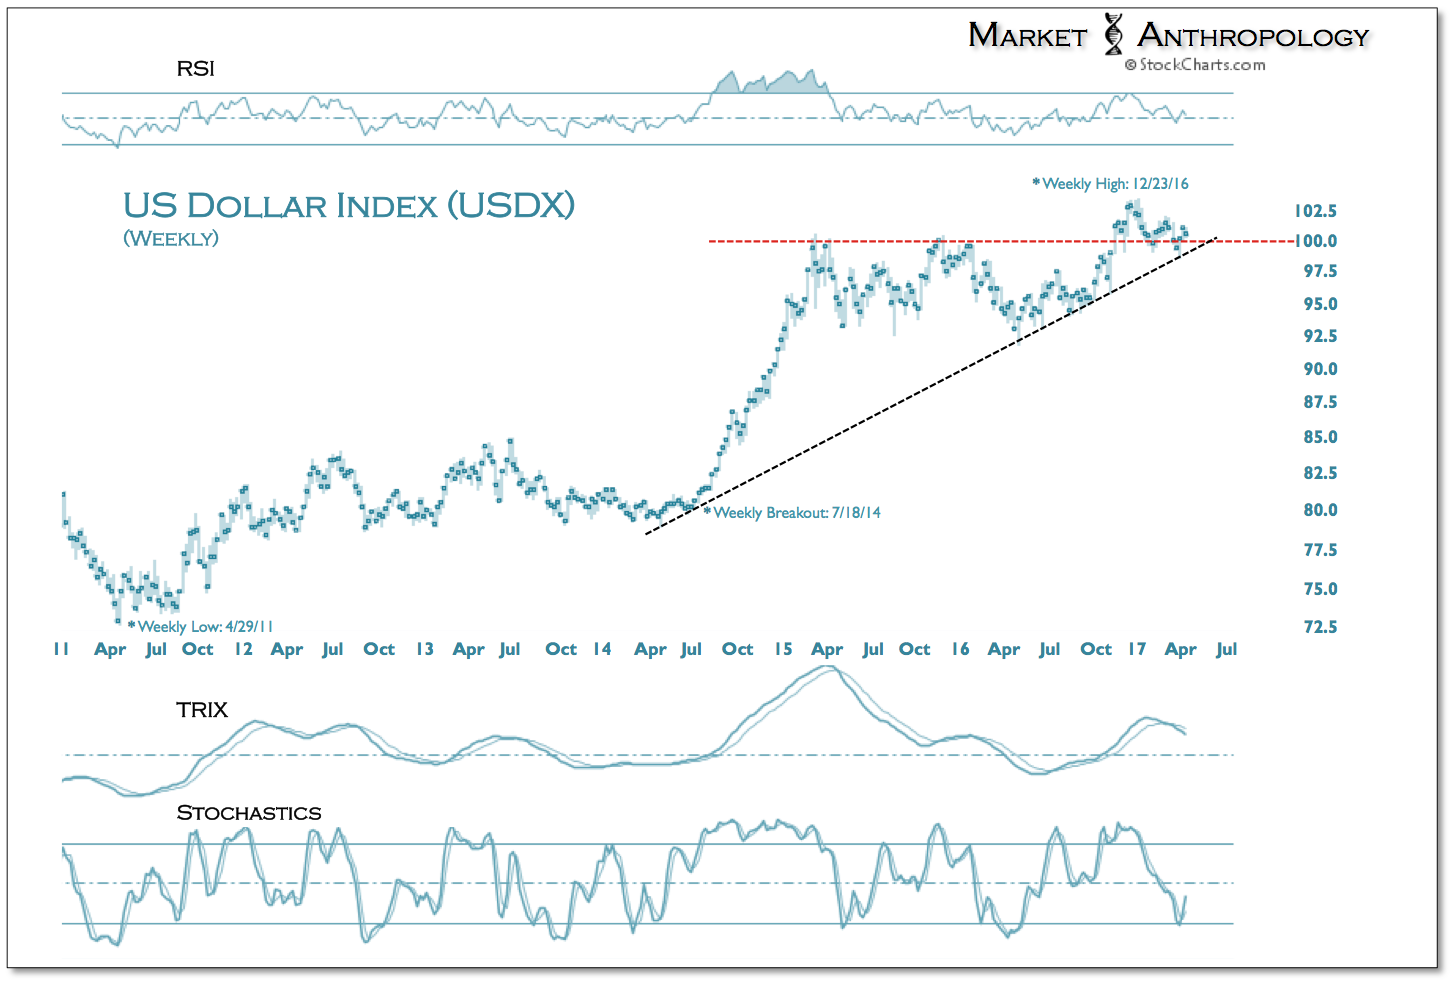
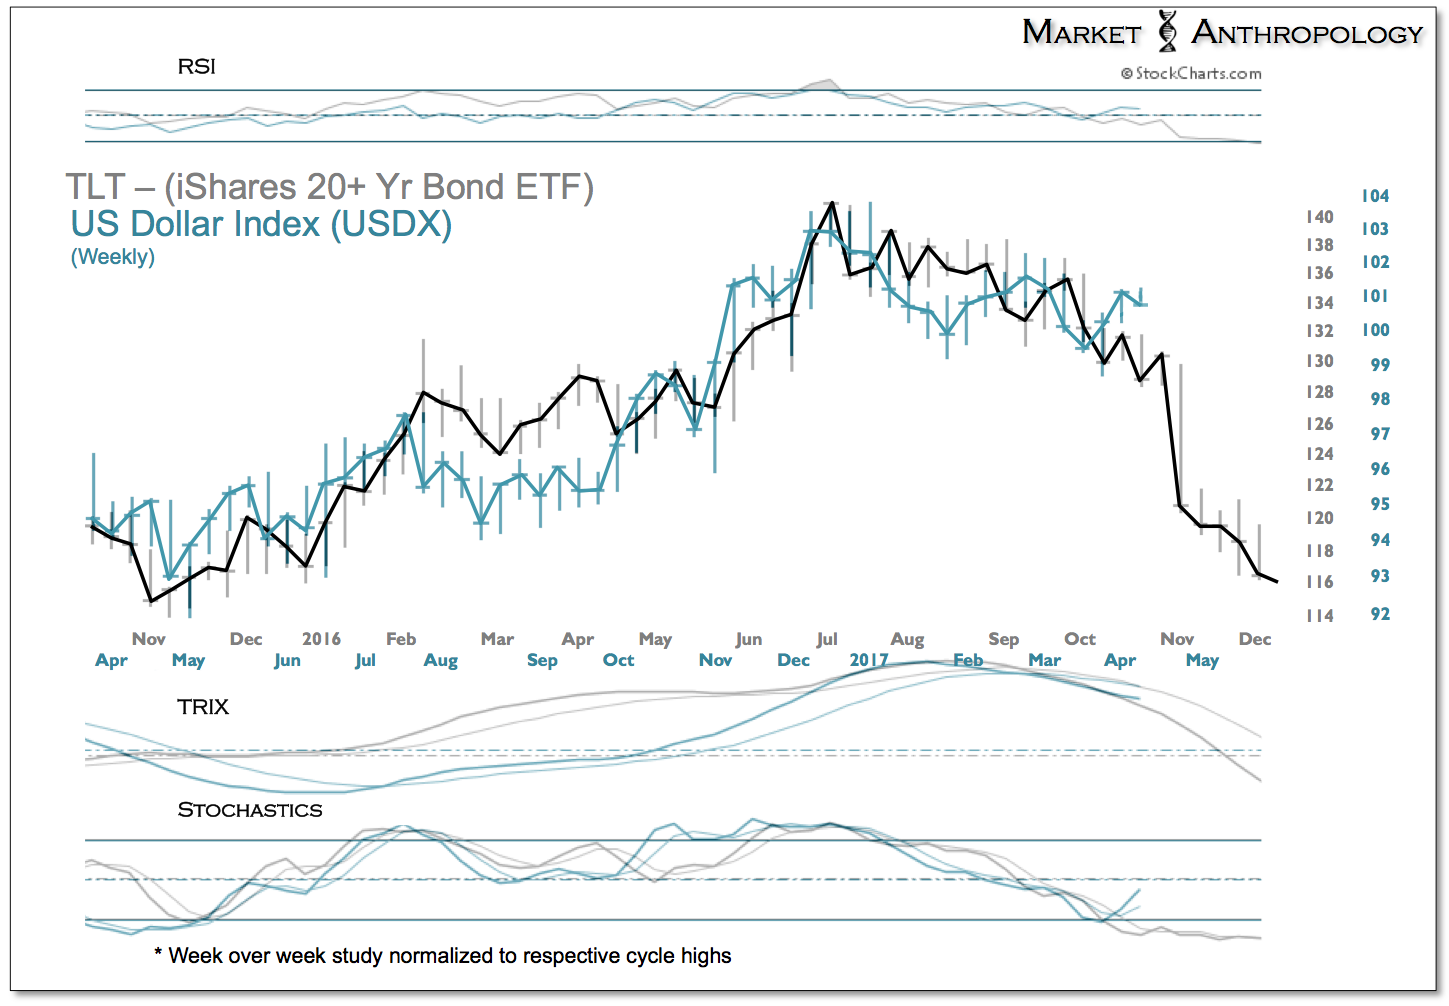
Over the past few months we have followed last year's breakdown in long-term Treasuries (via iShares 20+ Year Treasury Bond ETF (NASDAQ:TLT)) as a prospective leading move for the dollar, which has pointed towards a corresponding break around this April. And while it’s still early in the month, the dollar appears to be moving towards a market resolution that to-date has managed to escape dollar bears, as the index has traded within a very broad and relatively narrow range over the past 2 years.
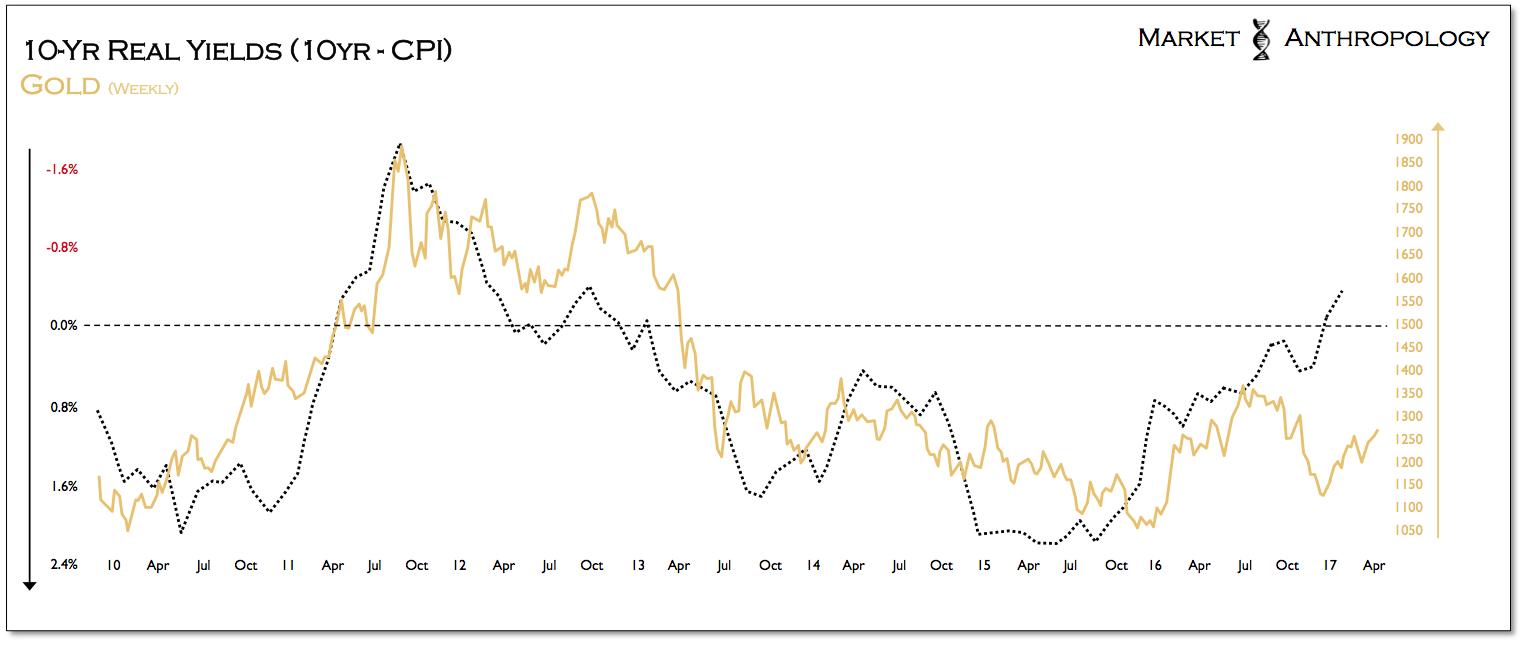
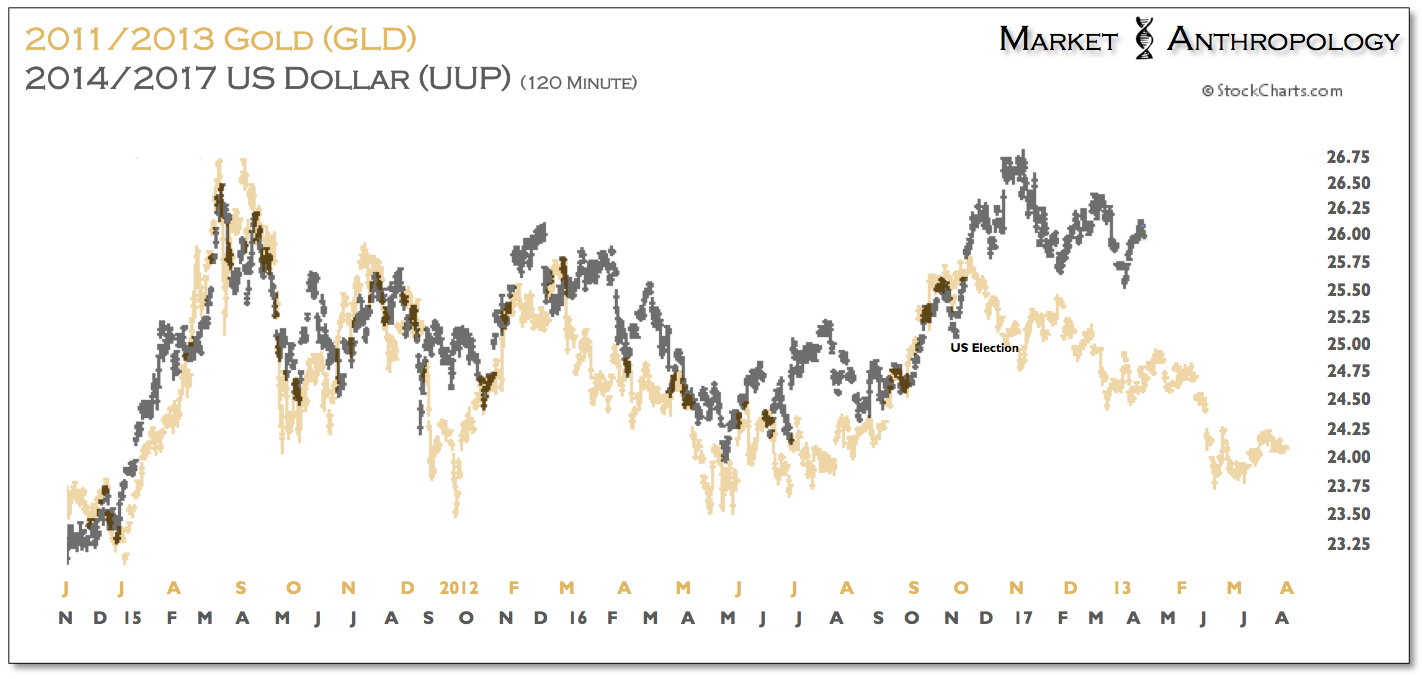
Coming into last fall, we had noted that the US dollar index (via PowerShares DB US Dollar Bullish ETF (NYSE:UUP)) was mimicking the broad top carved by gold (via SPDR Gold Shares Fund (NYSE:GLD)) back in 2011 through 2013, on the flip side of the cycle where inflation had crested in 2011 and the US dollar and real yields began to materially rise.
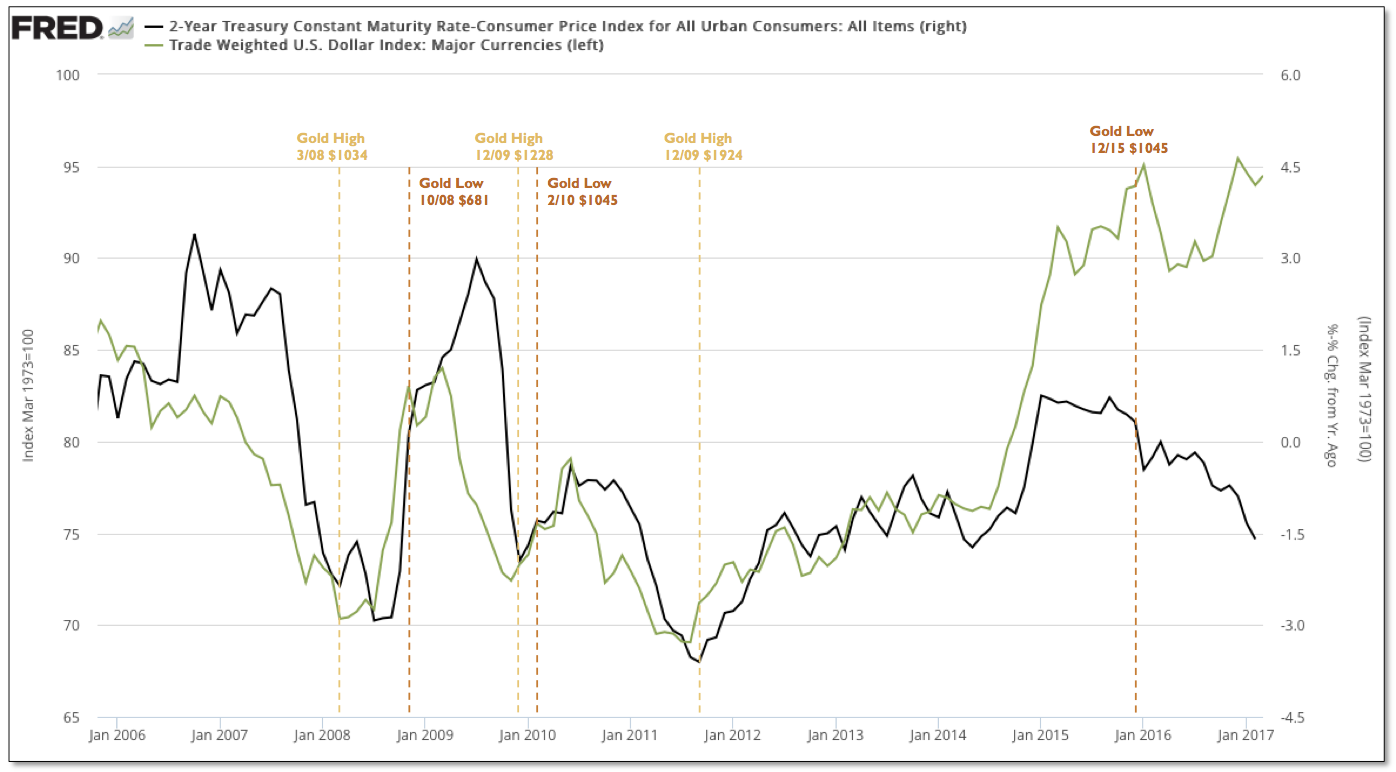
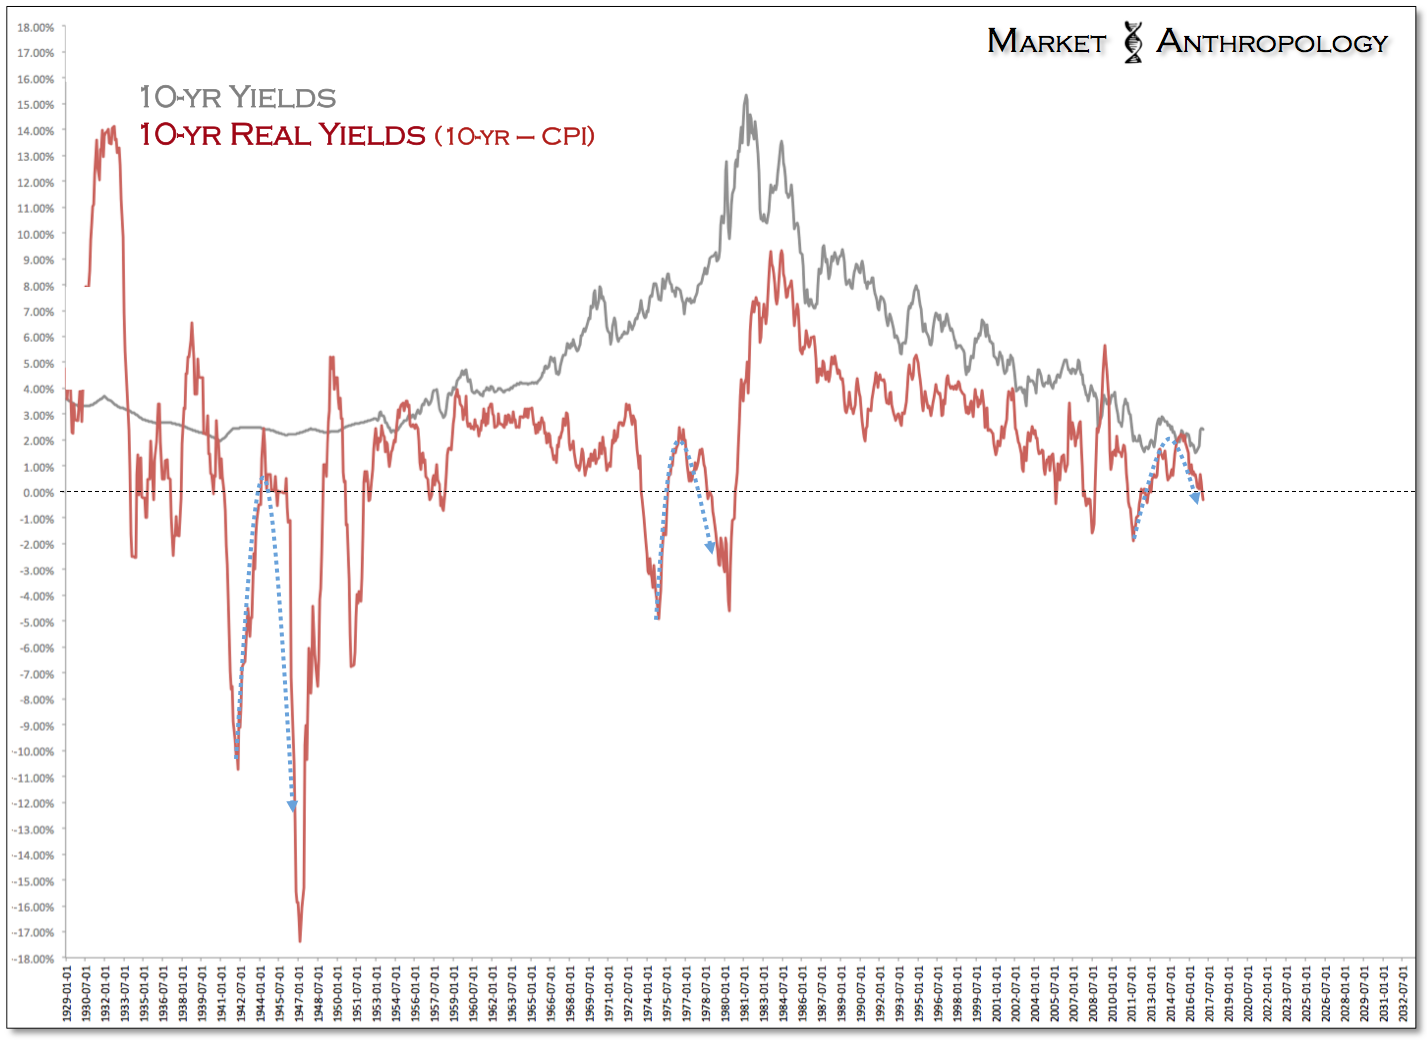
Since the end of 2015—when gold had set a cycle low in December as realized inflation had also begun to move out of the trough of the cycle—real yields began to crest and decline, despite the Fed’s policy shift in raising rates from ZIRP that month.
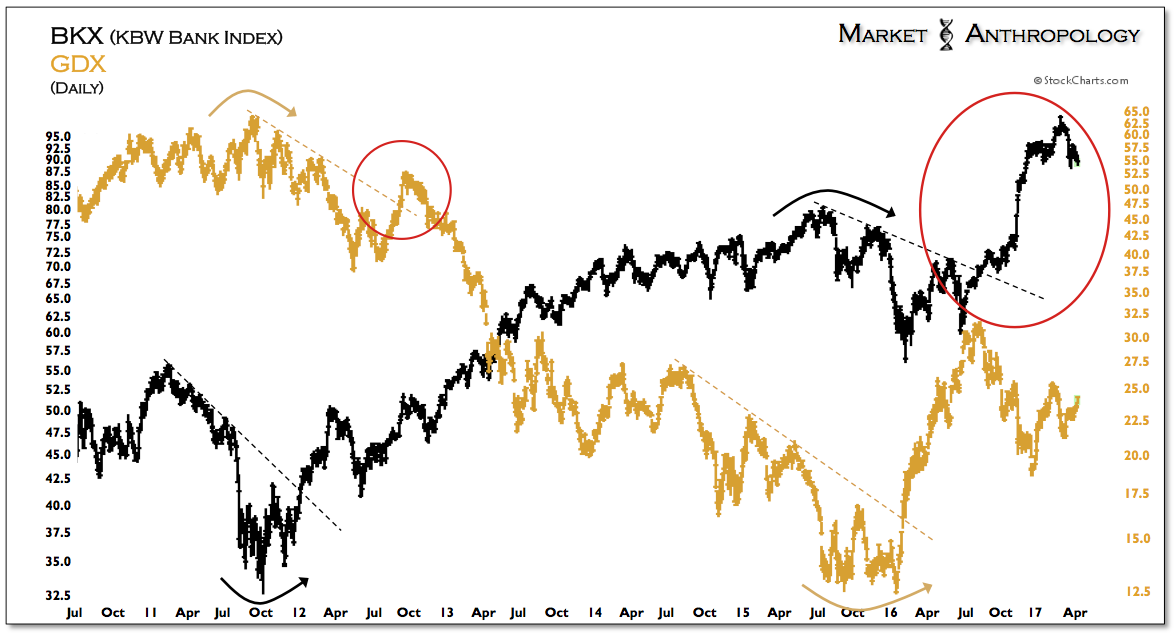
Through Q3 of last year, this inverse symmetry within the cycle was also reflected by the mirrored moves of the financials (via KBW Bank Index, BKX) and gold miners (VanEck Vectors Gold Miners (NYSE:GDX)), whose respective performance closely corresponded with trends in the dollar, inflation and hence the direction of real yields.
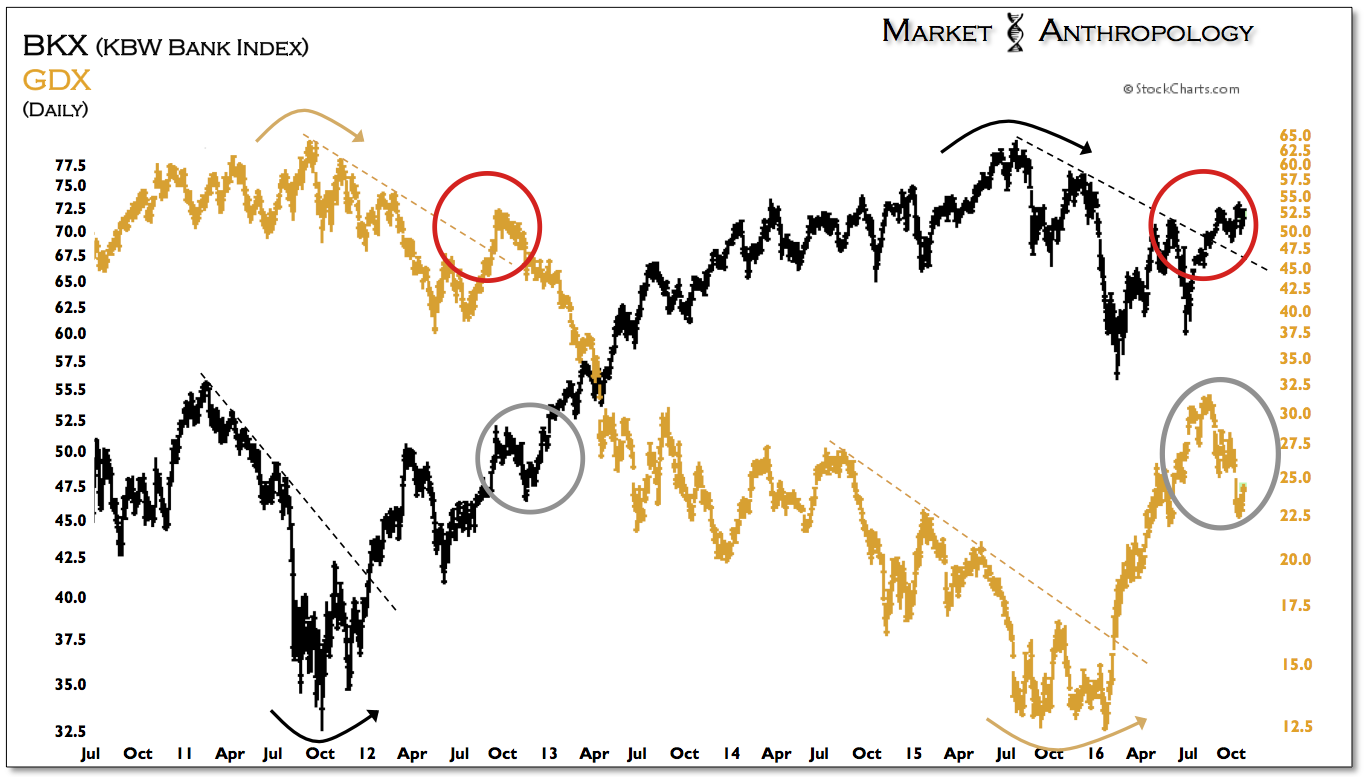
What’s happened since the US election last November is that the financials surged with nominal yields on hopes of a more beneficial operating environment for the banks, predominantly brought on by deregulation and tax reform. Conversely, the precious metals sector initially sold-off, as greater safe-haven demand evaporated overnight as yields and the dollar rallied sharply.
Although we had expected the banks to break above resistance for a spell in early fall with a corresponding retracement in the precious metals sector, the respective moves were outsized on the back of the election's newfound expectations.
This dynamic is reflected by the significant shift in business outlooks that transpired after the US election, as economic sentiment surveys sharply diverged higher from the actual realized data on the economy.
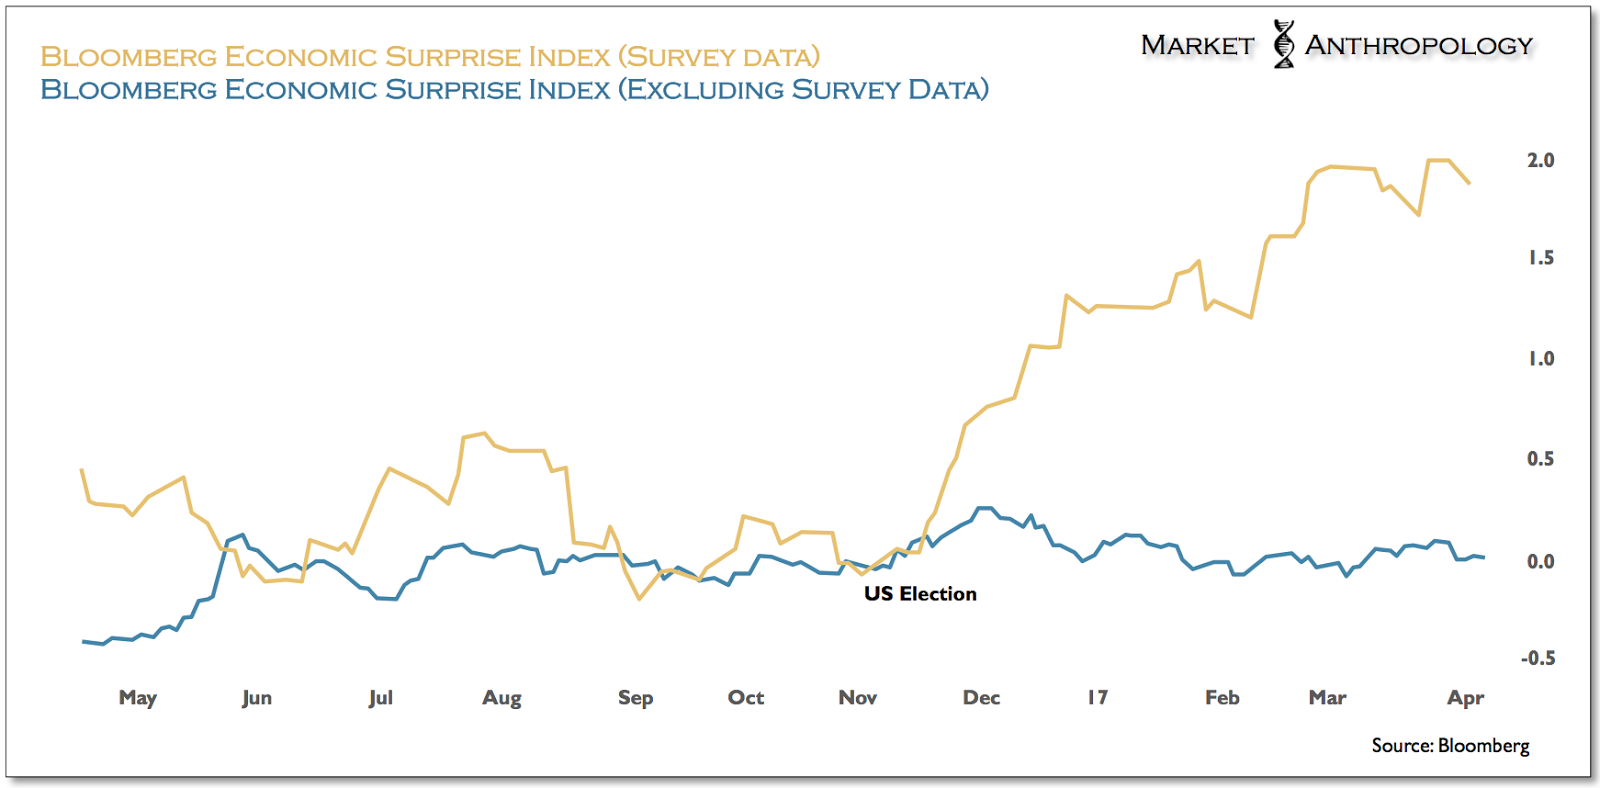
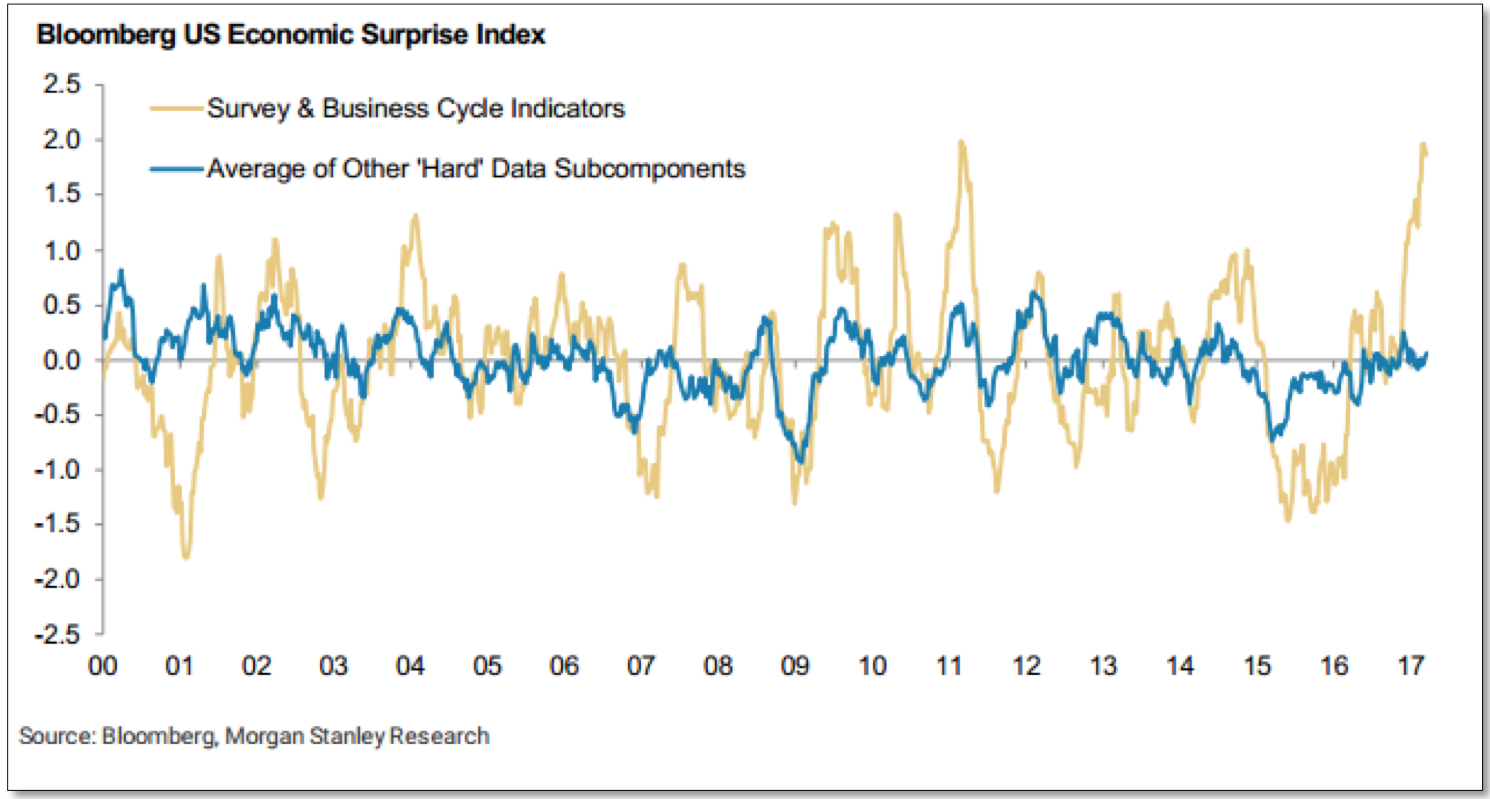
In fact, the spread between these so called hard and soft data series is the widest it's been over the past two decades. And while greater confidence can certainly positively affect downstream realized growth, eventually sentiment needs to give way to either businesses and consumers actually pulling the trigger on spending, or realizing that their respective hopes may have stepped ahead of reality.
With the third longest economic expansion since 1850 already in the record books and with the US job market even below what the Fed considers “full employment”, we’re more inclined to believe that while deregulation and tax reform can definitely improve conditions around the edges for businesses and consumers going forward, the real potential for robust growth that the recent sentiment surveys have implied has largely been tapped over the past several years.
This is why, from our perspective—which takes a very long-term view at both the nominal and real yield cycles—real yields will more likely continue to fall as the capacity for inflation outstrips underlying growth. This is contrary to how low real yield market environments have exhausted in the past, where growth explodes higher from a cycle low as inflation expectations recede from cycle highs (e.g. late 1940’s and 1970’s).
Moreover, considering the relatively lofty disposition of the US dollar, which rode the wave of US outperformance over the past six years, the capacity for higher inflation and lower real yields through broad dollar weakness remains substantial.
Overall, we continue to like the prospects for gold and the precious metals sector, as we view positions as primarily a higher beta inverse play on the dollar and real yields.
