Should the US dollar index follow the line of the comparative cyclical pivot with the euro and EUR/USD from 2011, the index will become vulnerable to breaking lower over the next few sessions as momentum in the retracement bounce turns down.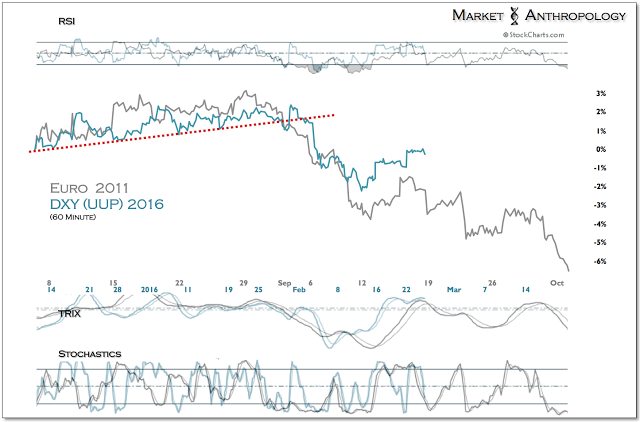
As outlined in a note a few weeks back, the US dollar index broke down from its rising wedge after rejecting new highs at the end of January. This pattern-break is reminiscent of how the euro and EUR/USD exhausted in 2011, as the US dollar put in a major low and the cyclical decline in commodities began. 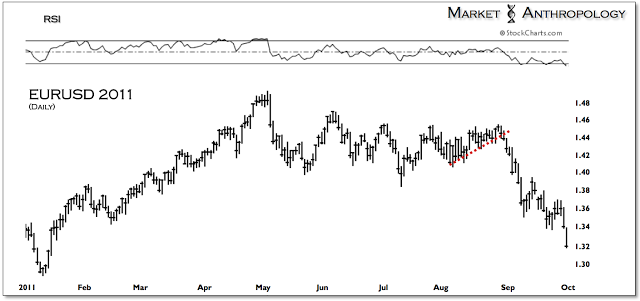
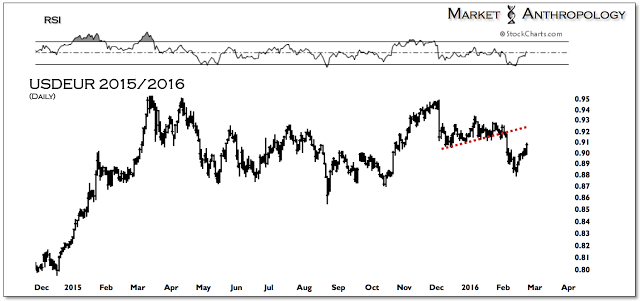
Looking back at why the currency comparison may hold relevance with today’s markets, you find parallels to what occurs when the funding currency du jour of the time reverses course from broader market pressures.
During the buildup to the 2011 commodity and equity market highs, the comparatively low rates in the US at that time enticed investors to borrow in US dollars and chase higher returns in commodities and tangential performing assets. Following Bernanke’s push for QE2 in August 2010, the immediate reflex in the markets was interpreted with practically an indiscriminate bid throughout the risk continuum, led by commodities emotional proxies of gold and silver.
As we noted at the time (here), although gold and silver are both leading indicators for commodities in general, their respective and relative performance with each other can reflect either end of the risk continuum. This is one reason we follow the silver:gold ratio and why its parabolic blowoff in April 2011 was an excellent outlier indicator that conditions were historically stretched and likely poised to shift—most notably in the currency and commodity markets.
As market confidence deteriorated with worsening conditions in Europe and structural and psychological support was weakened with the completion of QE2, risk appetites soured and investors broadly sold assets largely funded through a weak dollar. This fed back into the commodity markets, which up until 2011 had enjoyed widespread momentum from hedge funds and deep capital inflows from institutions trying to hedge dollar weakness and misplaced concerns with inflation (see here). When the dust settled in the fall of 2011 and global markets became soothed with large-scale initiatives by the Fed and ECB, a major disinflationary cyclical shift was underway in the markets, led by US dollar strength.
Today, we potentially have the inverse dynamic unfolding as widespread concerns with deflation and expectations that a stronger dollar is here to stay for the foreseeable future. Nevertheless, as global markets became destabilized over the past year and the Fed moved to normalize policy from extraordinary support, we believe the currency backdrop that largely wags the equity and commodity markets is gradually shifting towards a weaker US dollar.
The euro, the world’s second largest reserve currency and a major funding vehicle in the markets over the past several years, is finding support and breaking away from consensus expectations of parity with the dollar as investors sell riskier assets purchased with euros during less volatile market environments.
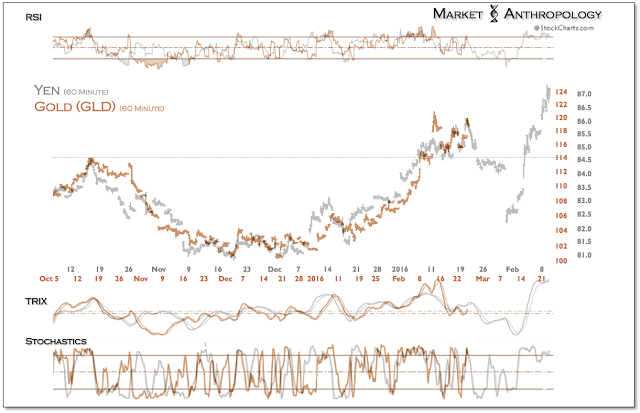
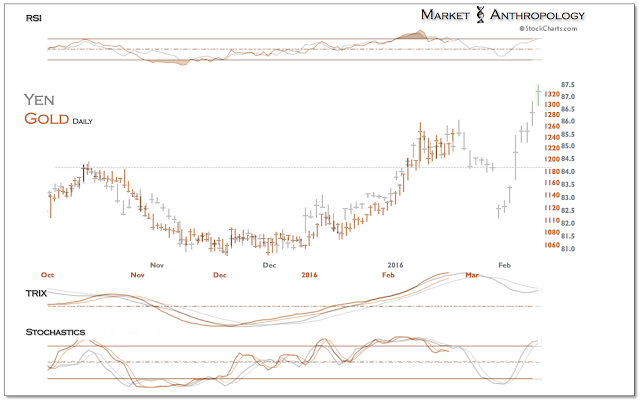
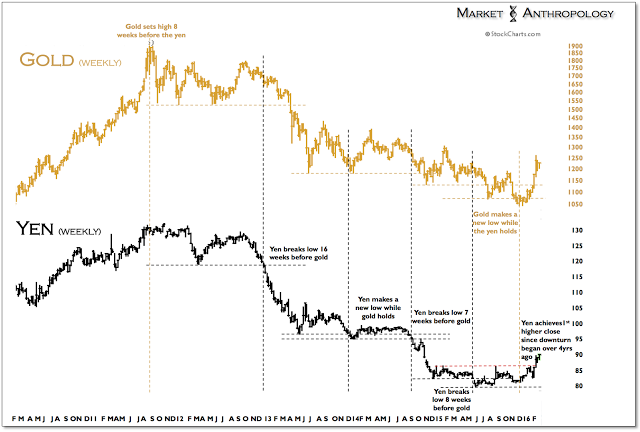
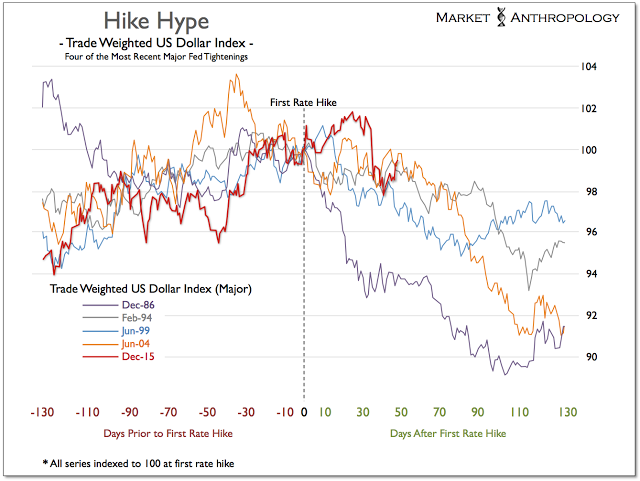
Recently, the Japanese yen has been the first major currency to break out of the broad base it established over the past two years and lead the move against the dollar as investors sell assets previously purchased through a weaker yen. Our suspicion is that the euro will also follow the yen’s lead and strengthen, as the US dollar index declines from the relative performance extreme achieved over the past year. Moreover, despite the fact that participants likely overestimated the eventual reach of rate hikes by the Fed this time around, the trade weighted dollar has loosely followed the turn of previous post-rate hike declines.
And while we suspect the longer-term implications to precious metals and commodities will ultimately be counter to the outcome of the 2011 market environment (i.e. bullish), the equity markets (via SPX, below) have recently broken along similar folds when normalized with the timeframe of the currency shifts going into the fall of 2011. 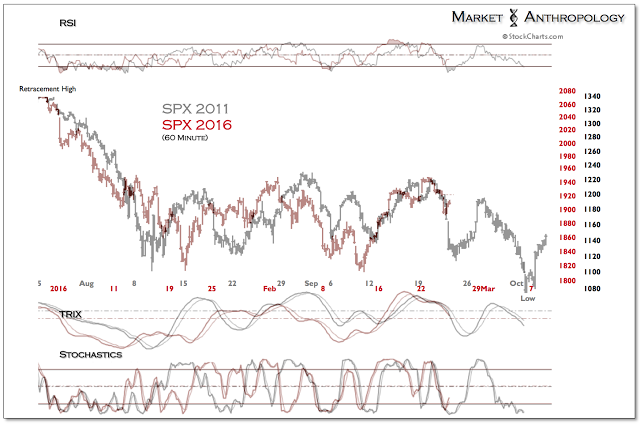
Back then at the start of Q3, the equity markets found a long-term low and were led higher by moves in the financials and assets greatly impacted by the value of the dollar; At the same time, inflation expectations that had recently broken down—such as gold, merely found a short-term low at the start of October.
Today we have the inverse dynamic developing as the banks (via KBW Bank Index (BKX)) have led the equity markets lower as gold and its respective miners (via Market Vectors Gold Miners (N:GDX)) have led the moves in the dollar, and we suspect the commodity sector in general. This comparative framework would point towards an interim low for the SPX coming into March with perhaps broader market weakness bleeding into the move in gold as well. 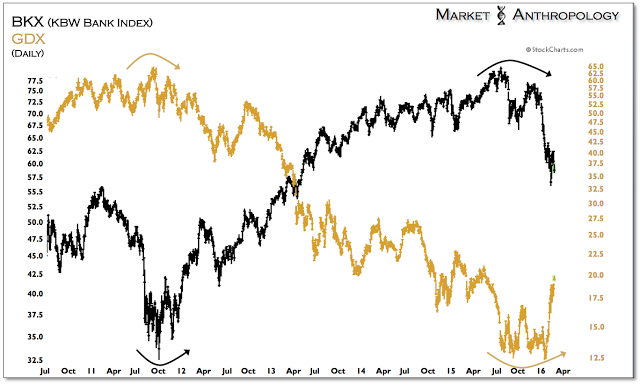
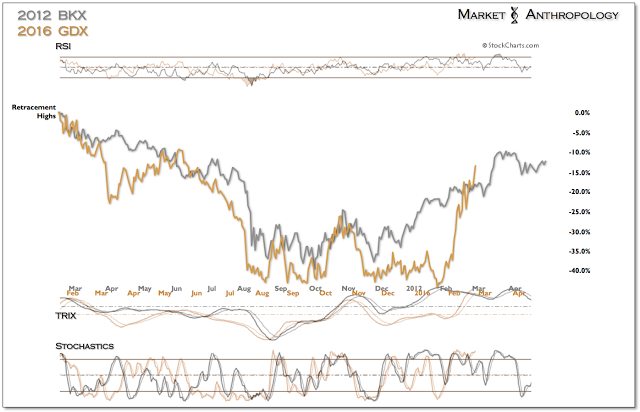
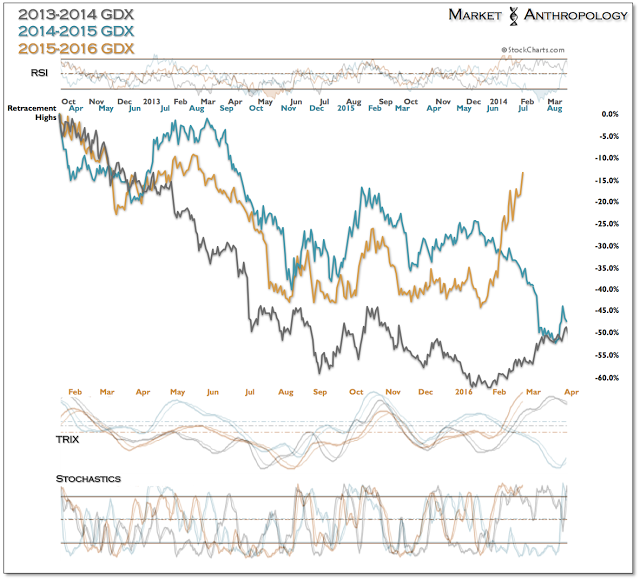
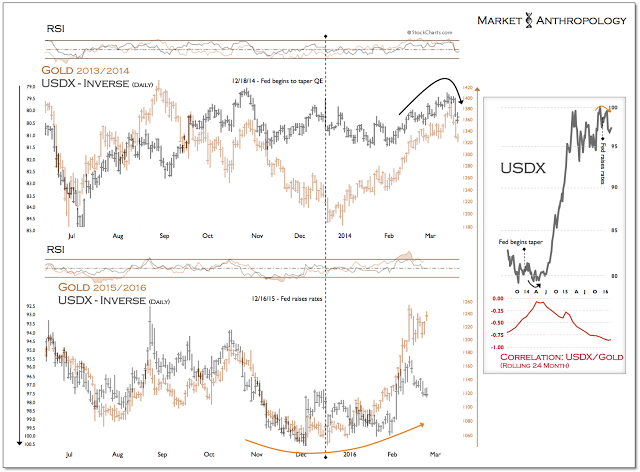
Interestingly, this perspective also dovetails into our lagged (see comparative with the yen), which points toward a large shakeout in gold (via SPDR Gold Shares (N:GLD)) over the next week or so. As we described in last week's note, based on the pattern in the yen, a move below last week's low would point towards this outcome. 