As long-term Treasuries find a bid of support (Figure 4) this week, we continue to follow a yield pattern developing along the lines of when the Fed first pivoted their policy posture in May 2013.
With the Fed perhaps moving towards leaving the crisis stance of ZIRP in December, the replication of market behavior in Treasuries this year has echoed the first steps taken by the Fed in 2013 to ease off on the extraordinary accommodations they were providing on a monthly basis in the market.
As shown below in Figure 2, the yield profiles of the two Fed phases from their respective lows, are similar in proportion and duration, with the breakout move in yields in May 2013 arriving ~ 10 months after the cycle low in July 2012.
With the interim low for yields occurring nearly 10 months ago, and with the December Fed meeting just a few weeks away, a window for that challenge appears to be open - albeit, still impressionable to heightened market anxieties from further tensions associated with recent terrorist atrocities.
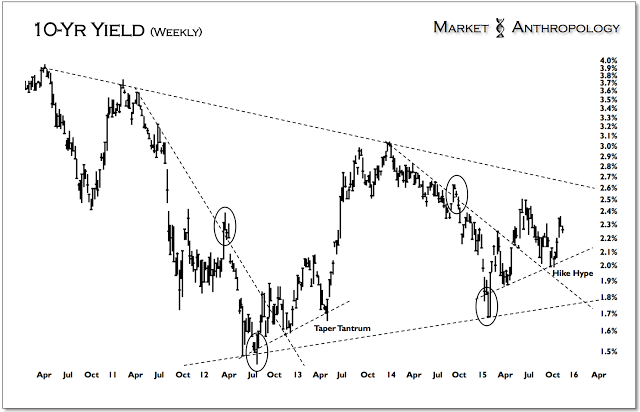 |
| Figure 1 |
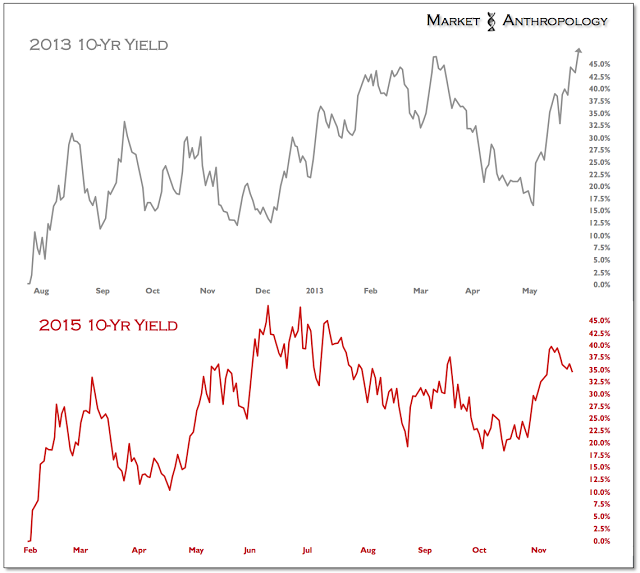 |
| Figure 2 |
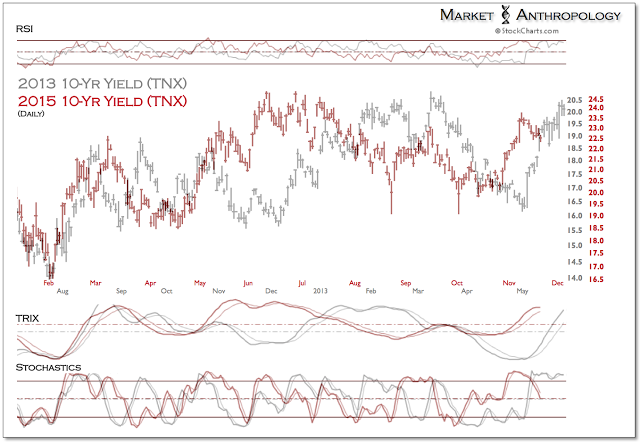 |
| Figure 3 |
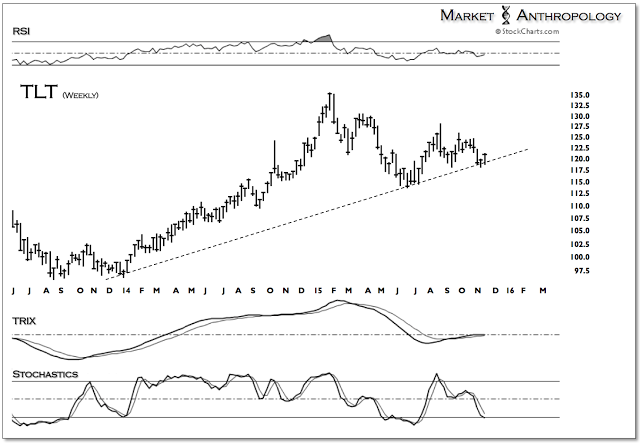 |
| Figure 4 |
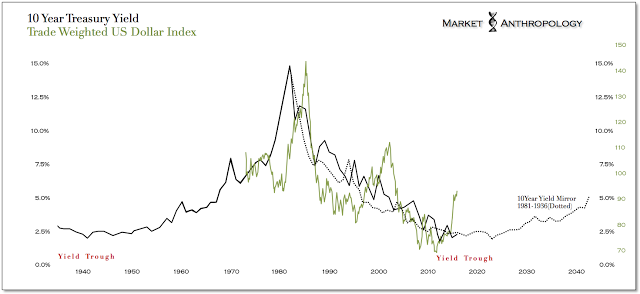
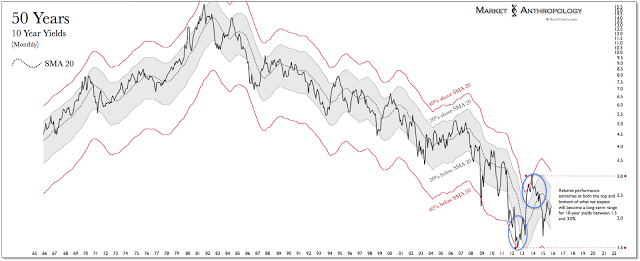
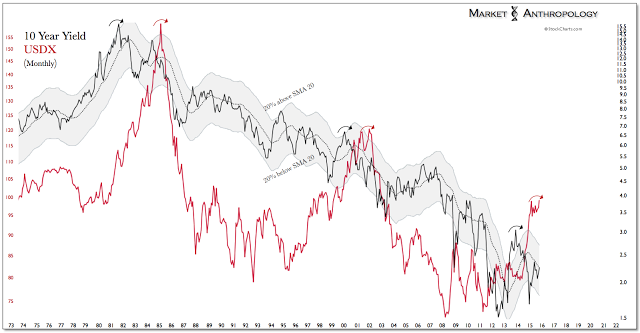
Historically speaking, we've noted that from a big picture cyclical perspective, the has followed major pivots in yields by several years (Figures 5 and 8). Over the past year we've approached the move in the dollar as completing the equivalent of what long-term yields accomplished in the first phase going into the initial taper in December 2013. At that time, we remarked that the 10-year yield was even more extended on a relative performance basis, than it was at its secular peak in September 1981 (Figure 6).
3rd party Ad. Not an offer or recommendation by Investing.com. See disclosure
here or
remove ads
.
 |
| Figure 5 |
 |
| Figure 6 |
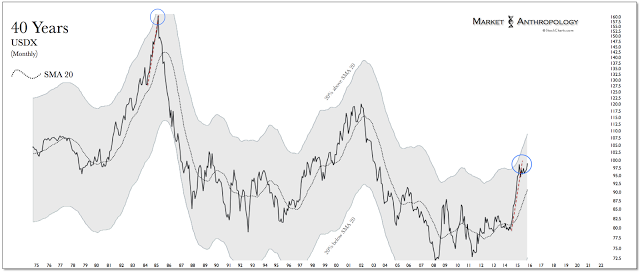
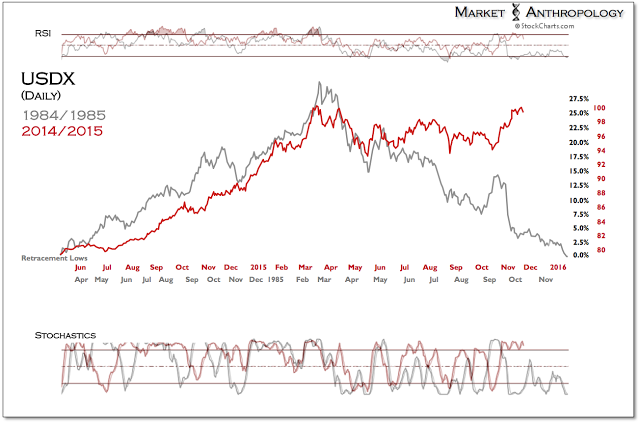
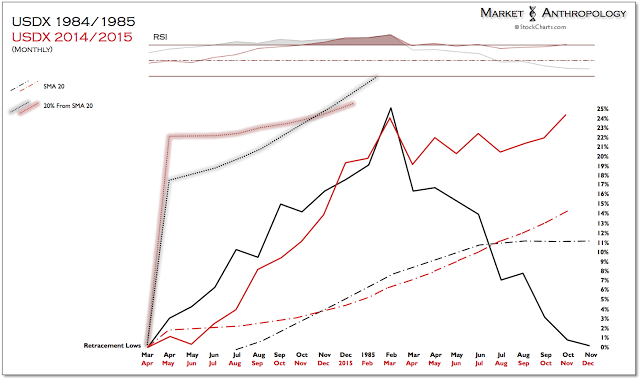
Correspondingly, the in March of this year became as stretched on a relative performance basis as it was at its secular peak in February 1985 (Figure 7). However, rather than completing the more symmetrical retracement akin to the 1985 pivot, the dollar has circled back and tested the highs from March this fall.
 |
| Figure 7 |
 |
| Figure 8 |
 |
| Figure 9 |
 |
| Figure 10 |
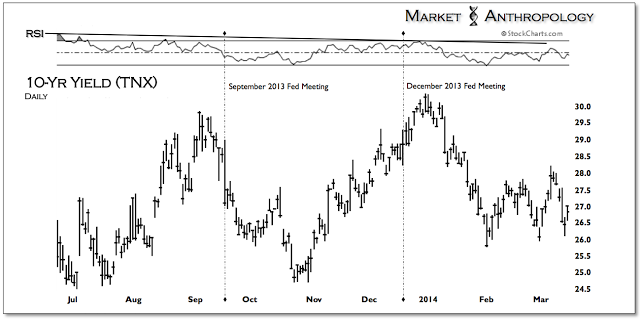
This is very similar to how yields performed going through the first taper in the back half of 2013, where the initial move going into the September Fed meeting was retraced after Bernanke surprised the markets and did not begin the taper - and moved the goalposts further back in the year.
 |
| Figure 11 |
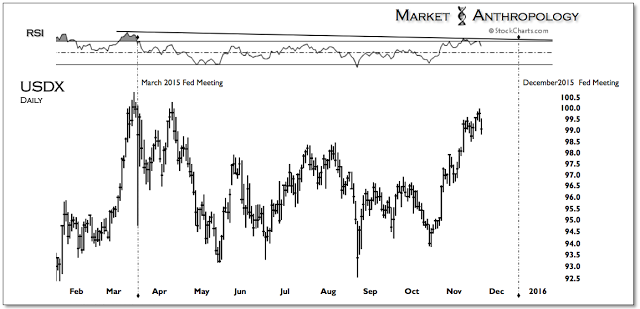
The same elongation in expectations transpired again this year after the March 2015 Fed meeting, where Yellen surprised many by pushing out the probability of raising rates off ZIRP to much later in the year.
 |
| Figure 12 |
With the index retesting the March highs, we still view the dollar as historically stretched and expect an outcome similar to how 10-year yields came through the beginning of the taper after retesting their September 2013 highs. As such - and ad infinitum, we find much greater long-term opportunities in positions that should benefit from a weak dollar market environment that we foresee extending through 2016.
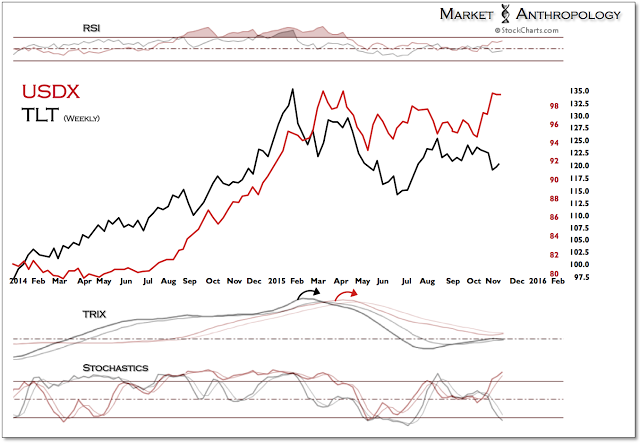
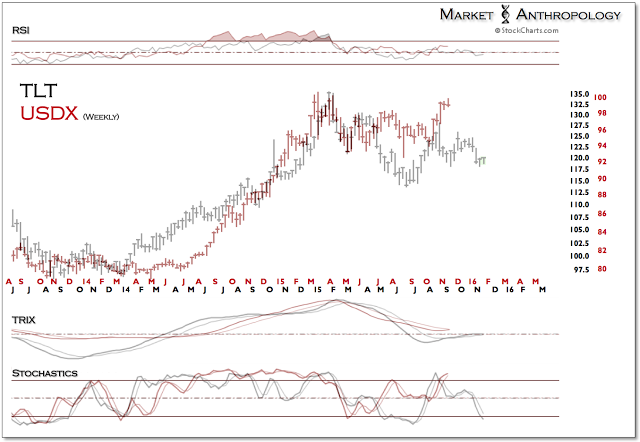
Moreover, on a shorter horizon, long-term Treasuries peaked at the end of January and turned down roughly two months before the US dollar index exhausted and made its move lower. By aligning the index back with the profile high of long-term Treasuries (N:), the dollar now trades where the secondary momentum high (negative divergence) in Treasuries was rejected and turned down at the end of summer.
3rd party Ad. Not an offer or recommendation by Investing.com. See disclosure
here or
remove ads
.
 |
| Figure 13 |
 |
| Figure 14 |


