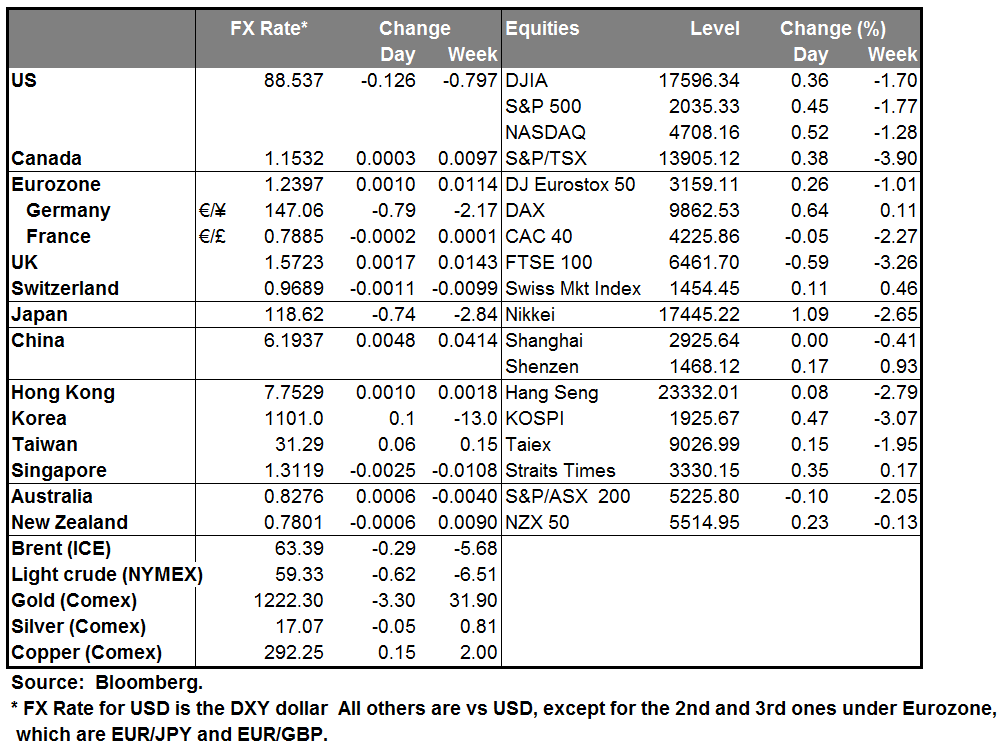
Investors continue to struggle with the implications of lower oil prices. Are lower prices good for the economy because they mean more cash in the hands of consumers? Or are they negative because they mean less capital spending (capital spending by the oil sector accounts for about one-third of capital spending by all the S&P 500 companies)? Higher-than-expected retail sales figures in the US yesterday lifted stocks 1.4% in the morning, with energy stocks being the strongest sector, but then another plunge in oil prices (for no clear reason) sent stocks down 1% from their highs, with energy as the worst performing sector. Meanwhile, the VIX index of implied volatility on stock options rose yet again for the largest four-day advance since 2011 as investors worried that the drop in oil could destabilize financial markets.
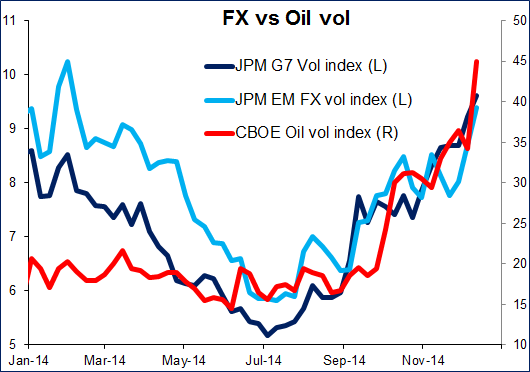
Personally, I own a car but no oil wells, so lower oil prices are an advantage for me and I assume other consumers are in the same condition. The idea that if companies don’t spend their money digging oil wells then they won’t spend money at all seems illogical to me. As consumers spend their money on other things besides gasoline, then other companies will invest in other things, too, such as auto manufacturing plants. Of course, things could be different in a zero marginal cost economy. If consumers spend their money on music downloads instead of filling up their car, then maybe server farms will have to expand somewhat but the economic effect on investment and employment probably won’t be as great as drilling more wells.
AUD dropped sharply after Reserve Bank of Australia (RBA) Gov. Stevens was interviewed in the Australian Financial Review. He said he thought “it’s quite likely” that AUD would be lower a year from now and he lowered his target rate for AUD. “...A year ago I said probably 85 U.S. cents was better than 95. And if I had to pick a figure now, I would say probably 75 is better than 85,” Stevens said. With the currency now trading around 83 US cents, that still leaves substantial downside. I expect that slower Chinese growth and falling commodity prices will continue to exert downward pressure on AUD.
Other commodity currencies were also under pressure as oil prices fell. USD/CAD reached a new high for the year as Bank of Canada Gov. Poloz said that Canada’s labor market still shows considerable excess capacity. Most EM currencies were also under pressure, led by oil producers MXN, BRL, RUB and IDR. Oil importing currencies, such as SGD, KRW and TWD, fell vs USD as well but nowhere near as much.
Today’s market: During the European morning, Sweden’s PES unemployment rate for November came out as expected at 4.1%, down from 4.2% in October. This was in line with the decline in the month’s official unemployment and had little impact on SEK, which was weakening into the figure. Thursday’s data showed that the country remains stuck in deflation, which reinforces our expectations that the Riksbank is likely to move towards unconventional measures, perhaps even as soon as next week’s meeting. Finally, Eurozone’s industrial production is forecast to have slowed in October.
In the US, the headline PPI for November is expected to have risen 1.4% yoy, a slowdown from +1.5% yoy in October, while the core rate (excluding food and energy) is forecast to remain unchanged at +1.8% yoy. That should not be a major market-mover. The preliminary UoM consumer sentiment for December is forecast to show a modest rise.
We have only one speaker on Friday’s agenda: Norges Bank Governor Olsen speaks at an event in Oslo. It’s unlikely he will surprise the market any more than yesterday’s cut in the deposit rate did. His comments could however give the currency another leg down.
Sunday will be the Japanese Lower House election. The overall result is not in question: the ruling Liberal Democratic Party will win. The only question is how big a victory they will get. They currently have 294 seats in the 475-seat house. If they get a two-thirds majority, or 317 seats, then they will no longer need to rule in a coalition with the Komei Party. Since the polls have shown a comfortable LDP victory, people opposed to the LDP are losing interest in voting, which makes it all the more likely that they will win big. If they do get a supermajority, then there are concerns that the government could change its focus to PM Abe’s social and political goals rather than economic goals. That could be bad for stocks and therefore send USD/JPY lower. On the other hand, if they remain in power through a coalition, then his victory would strengthen his hand in dealing with the Ministry of Finance and with opponents in his own party who oppose his “third arrow” of structural reform. That could be good for Japanese stocks and hence send USD/JPY higher. A substantial loss of seats would be the biggest surprise and probably send stocks and USD/JPY lower as it could endanger his reform policy.
The Market
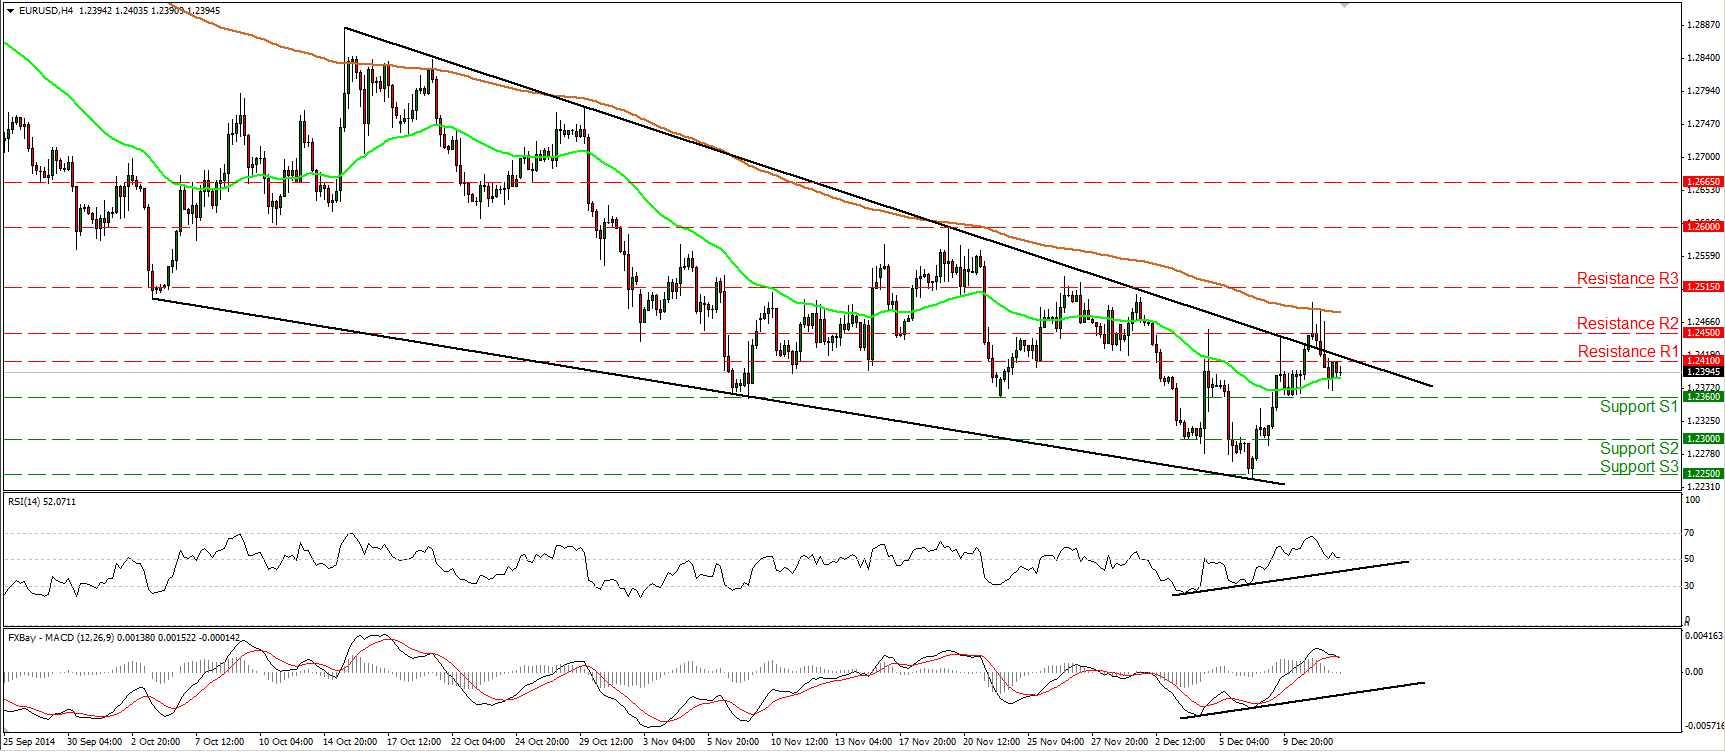
EUR/USD back below the downtrend line
EUR/USD slid after finding resistance near the 200-period moving average to trade back below the black downtrend line. However, given that the positive divergence between our near-term oscillators and the price action is still in effect, the possibility for a higher low and another break above the trend line still exists. A move above 1.2450 (R2) could reaffirm the case and pull the trigger for the resistance line of 1.2515 (R3). On the daily chart, the rate is still printing lower highs and lower lows below both the 50- and the 200- day moving averages and this keeps the overall path to the downside. However, I still see positive divergence between the daily momentum studies and the price action, which indicates that the longer-term downtrend is losing momentum and that further upside corrective waves could be looming.
• Support: 1.2360 (S1), 1.2300 (S2), 1.2250 (S3)
• Resistance: 1.2410 (R1), 1.2450 (R2), 1.2515 (R3)
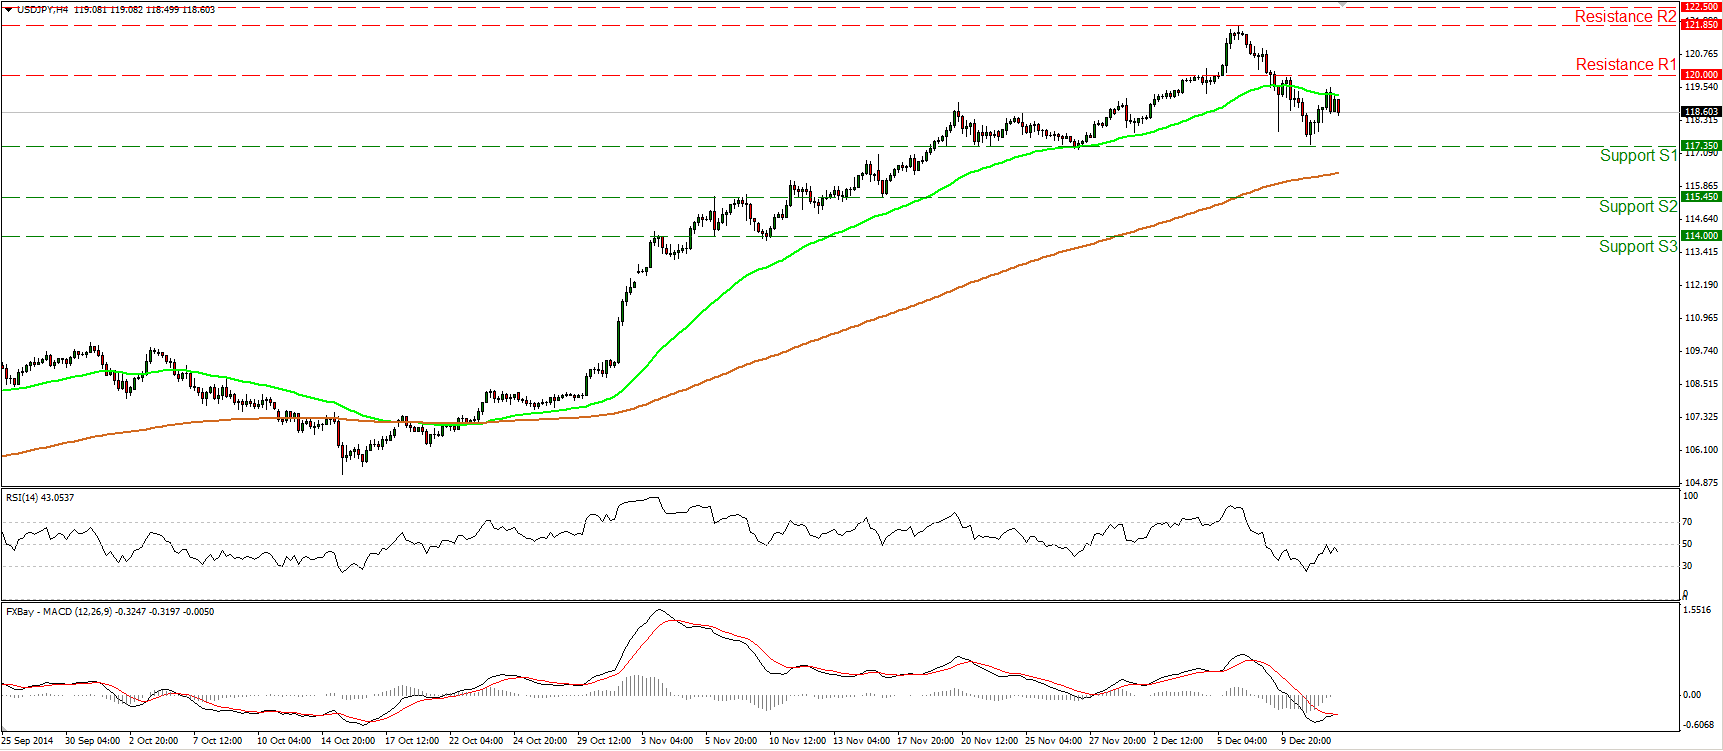
USD/JPY finds buy orders near 117.35
USD/JPY rebounded on Thursday after triggering some buy orders near 117.35 (S1). Nonetheless, I would prefer to see another break above the key line of 120.00 (R1) before getting confident about the upside. As long as the rate remains below that line, I see chances that the downside corrective move may extend a bit lower. Our daily momentum studies support the notion: the 14-day RSI fell near its 50 line after exiting its overbought territory, while the MACD, even though at extremely high levels, stands below its trigger line and is pointing south. As for the broader trend, the price structure is still higher peaks and higher troughs above both the 50- and the 200-day moving averages and this keeps the overall path of USD/JPY to the upside. Therefore, I would consider the recent setback or any extensions of it as a retracement of the longer-term uptrend.
• Support: 117.35 (S1), 115.45 (S2), 114.00 (S3)
• Resistance: 120.00 (R1), 121.85 (R2), 122.50 (R3)
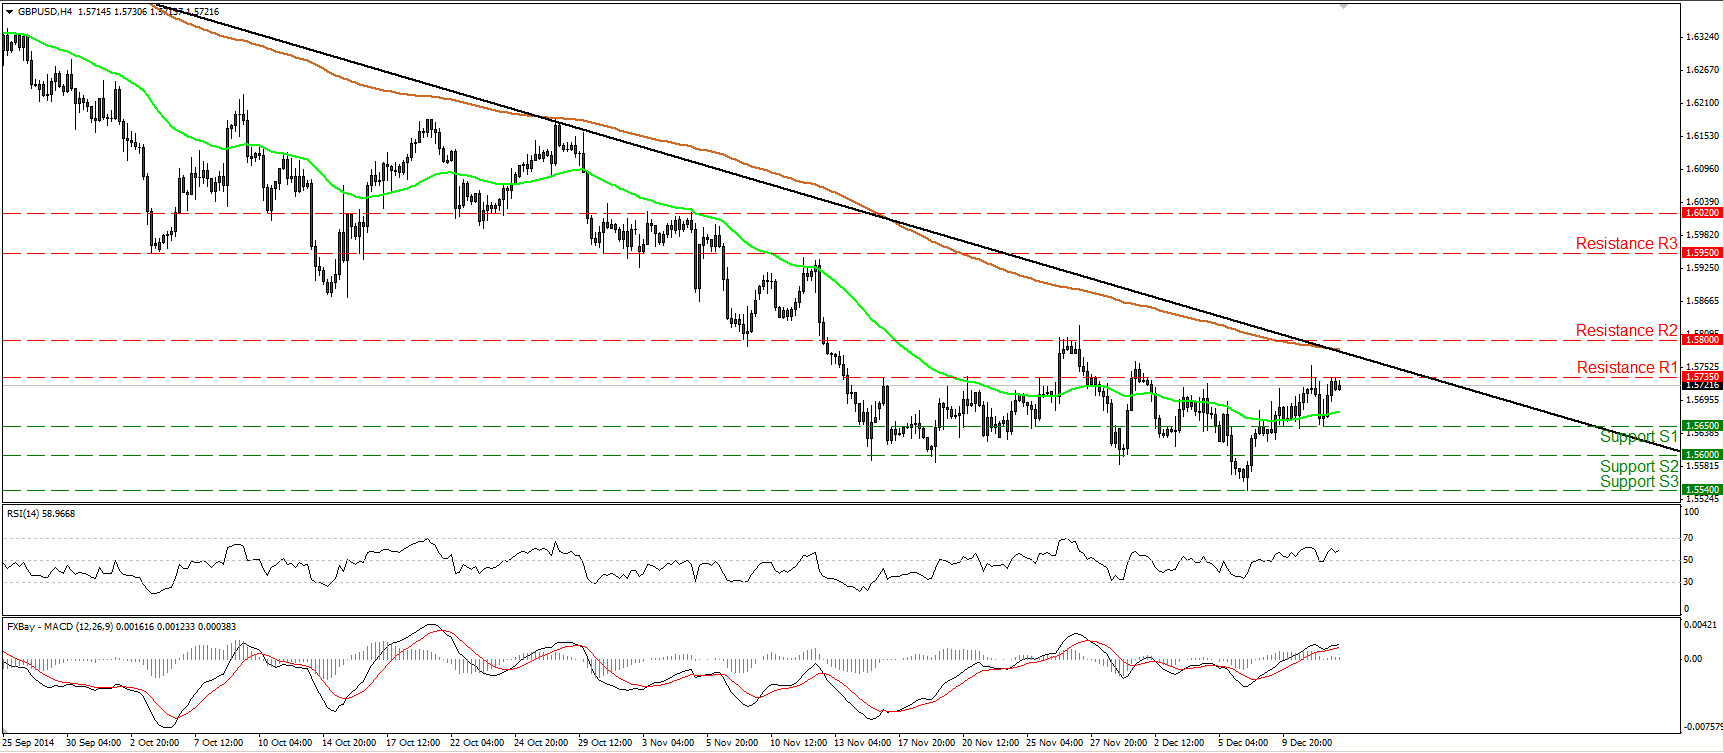
GBP/USD approaching the longer-term downtrend line
GBP/USD firmed up after finding support at 1.5650 (S1), but the advance was halted by the 1.5735 (R1) barrier. With no clear trending conditions on the 4-hour chart, I would adopt a neutral stance as far as the short-term picture is concerned. On the daily chart, I still believe that as long as Cable is trading below the 80-day exponential moving average, the overall path is negative. But our daily momentum studies are in a rising mode, supporting the possibility that a test near the black downtrend line or even a break above it may be looming. The RSI moved higher and now lies near its 50 line, while the MACD stays above its trigger and is pointing up. I would treat any bullish waves that stay limited below the 80-day exponential moving average as renewed selling opportunities.
• Support: 1.5650(S1), 1.5600 (S2), 1.5540 (S3)
• Resistance: 1.5735 (R1), 1.5800 (R2), 1.5950 (R3)
WTI dips below 60.00
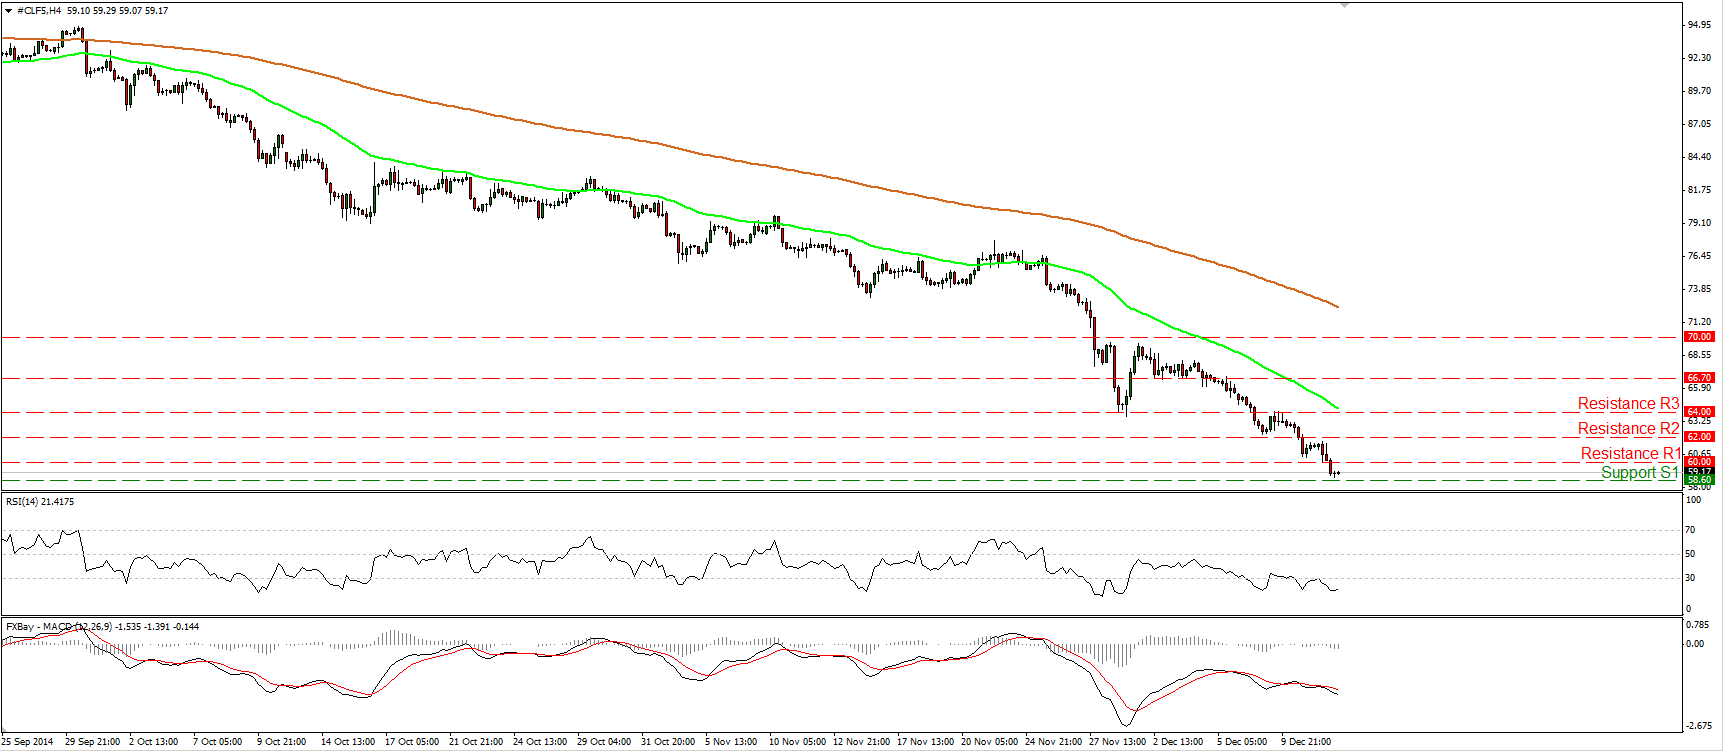
WTI continued its tumble on Friday, breaking below the psychological barrier of 60.00 (R1). The decline hit support a few cents above our support level of 58.60 (S1), the low of the 10th of July 2009. A dip below that barrier is likely to challenge the 56.65 (S2) hurdle, defined by the lows of the 15th and 16th of May 2009. Our daily technical studies paint a negative picture. Both the 50- and the 200-day moving averages stand above the price curve and their slope stays to the downside. The 14-day RSI stays within its oversold territory pointing down, while the daily MACD, already at extreme low levels, stands below its trigger line pointing down as well. These momentum signs designate strong downside momentum and reinforce the case that we are likely to see lower oil prices in the close future.
• Support: 58.60 (S1), 56.65 (S2), 55.00 (S3)
• Resistance: 60.00 (R1), 62.00 (R2), 64.00 (R3)
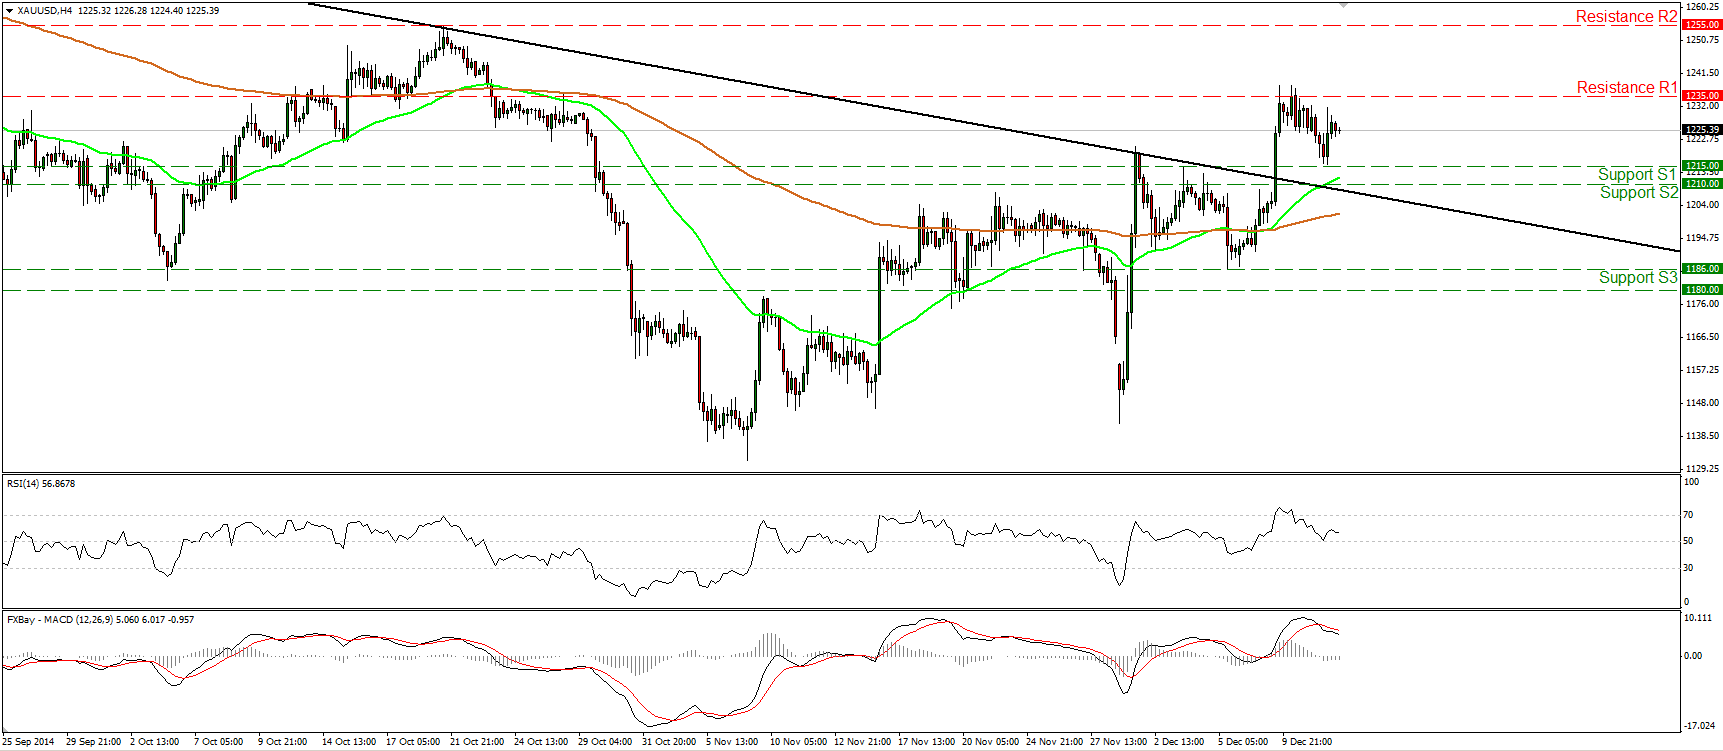
Gold hits support at 1215
Gold pulled back on Thursday but triggered some buy orders near 1215 (S1). As long as the precious metal is trading above the black downtrend line taken from back the 10th of July, I would still consider the outlook to be mildly to the upside. A clear move above the 1235 (R1) is likely to reaffirm the case and perhaps prompt bullish extensions towards our next resistance barrier at 1255 (R2), determined by the high of the 21st of October. It is worth noting that the 1255 (R2) obstacle currently coincides with the 200-day moving average. Our daily oscillators corroborate my view. Both of them are in a rising mode and the both lie within their positive territories.
• Support: 1215 (S1), 1210 (S2), 1186 (S3)
• Resistance: 1235 (R1), 1255 (R2), 1270 (R3)

