Energy gains are being dialed back as production restarts in the Gulf of Mexico while gold marks time. Agricultural commodities are mixed, though the majority are under pressure from abundant supply.
Energy
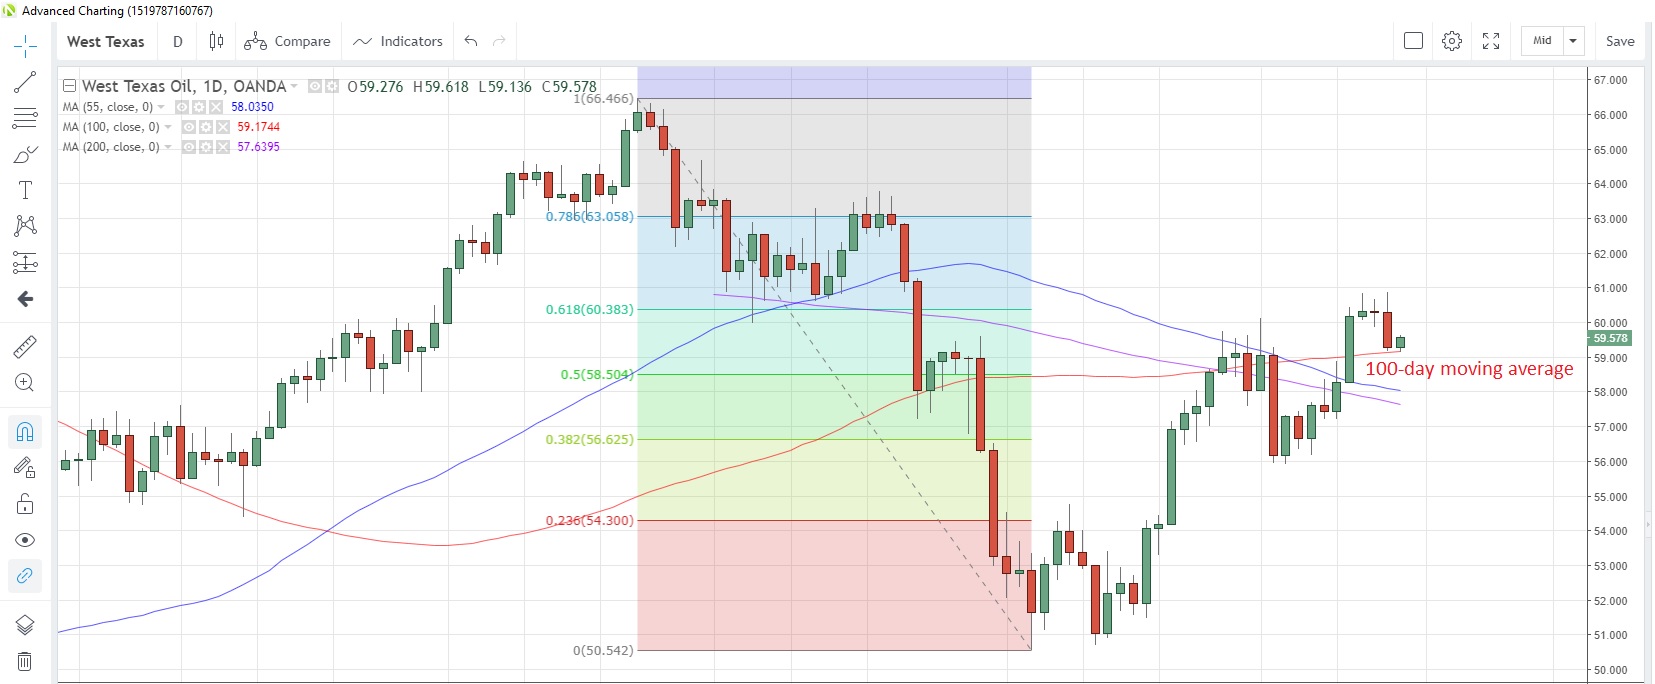
Slower China Q2 GDP, easing Middle East tensions and better weather conditions in the Gulf of Mexico all combined to pull CRUDE OIL prices from 7-1/2 week highs yesterday. Last week, storm Barry had halted more than 70% of production in the Gulf of Mexico which, combined with weekly data showing a large drawdown in stockpiles, had boosted prices to the highest since May 23.
Xinhua News reported that China’s oil output in June was unchanged from the previous month but 1% higher year-on-year, but the nation still imported 40 million tons of crude oil in the month. Meanwhile, the Korea Customs Service stated that South Korea imported 11.5 million tons of crude in June, a 13% reduction from a year earlier.
Non-commercial positioning showed that investors trimmed net long positions in the week to July 9, according to CFTC.
WTI Daily Chart

NATURAL GAS prices declined yesterday as weather forecasts for warmer weather in the central and eastern parts of the US were scaled back. However, the weather outlook for Europe remains upbeat for the period.
Gas prices remain under pressure amid excess supply and inventory, with the latest stockpiles data to July 5 showing an increase of 81 billion cubic feet (bcf), which is above the five-year average of 71 bcf. China’s gas output in June rose 13.1% from a year earlier to 13.9 billion cubic meters.
Speculative investors reduced their net short positions for a second consecutive week, according to data as at July 9 published by CFTC.
Precious metals
GOLD prices continue to consolidate within an unfolding triangle formation, seemingly lacking the momentum to retest the more than six-year highs seen last month. Gold's lack of upward momentum is causing some speculative investors to scale back net long positions, with data showing the first reduction of net longs in six weeks, pulling them back from the most bullish since September 2016.
However, exchange-traded funds (ETFs) were seen buying physical gold in the last trading session, according to a Bloomberg report yesterday. Holdings by ETFs are now at the highest since July 2018.
SILVER is looking to build on last week’s advance, the first in three weeks, with further gains this week. Prices have held above the 200-day moving average, which is at 15.0208 today, on a closing basis since June 17.
Speculative investors trimmed their net long positions for a second week, CFTC data to July 9 show, while ETFs added to holdings for a fifth straight day in the latest session. Net purchases for this year now total 26.2 million ounces as silver has risen 5.9% to 15.35 this year.
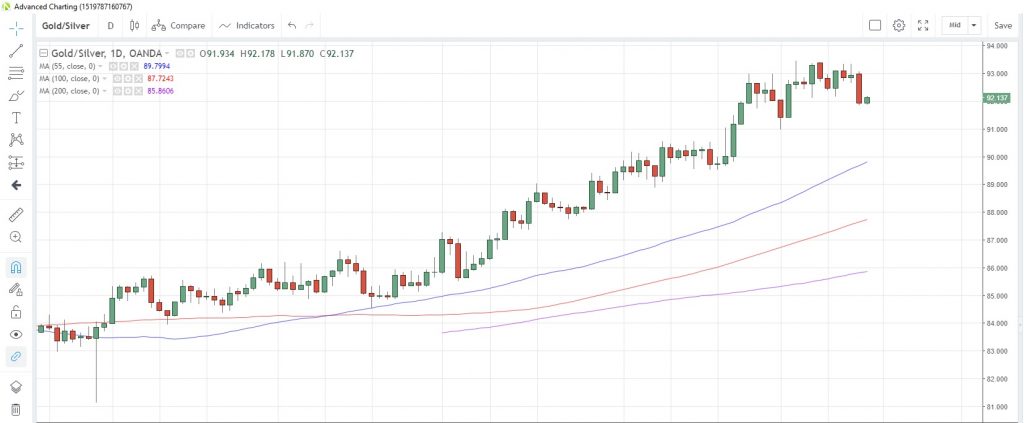
The gold/silver (Mint) ration posted its first weekly loss in five weeks last week as gold failed to extend its rally. Losses continue into this week and so far have run up the biggest weekly decline since April.
Gold/Silver Daily Chart

PLATINUM prices have been testing the 100-Day moving average resistance at 842.49 for the past two days, barely closing above it yesterday for the first time since May 15. The gains have not extended into today, with losses of 0.22% posted so far.
PALLADIUM snapped a five-week rising streak last week as the commodity retreated from 3-1/2 month highs. The precious metal is now at 1,564, hovering below the July 11 high of 1,604. Speculative investors remain bullish on the commodity, increasing net longs for an eighth consecutive week to July 9 and boosting them to levels not seen since the week of March 3.
Base metals
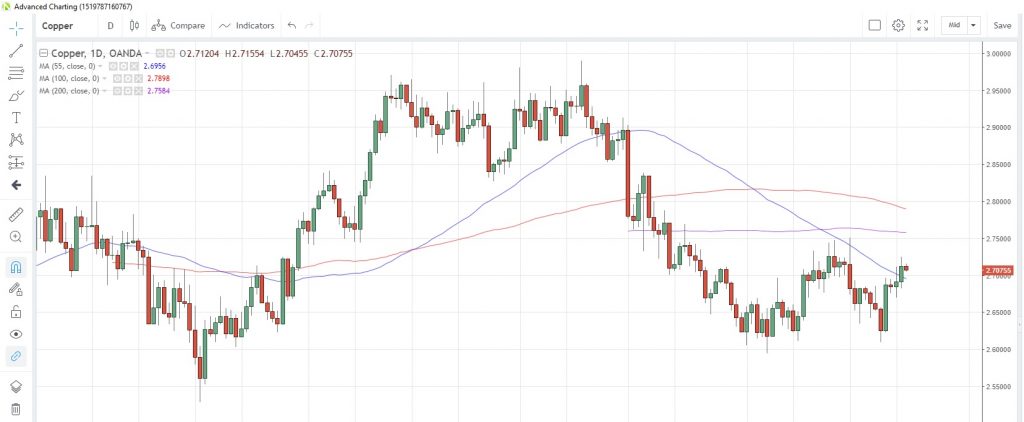
COPPER prices were given a boost yesterday after China released better-than-expected industrial production data for June. This data proved to be more influential than the weaker growth numbers for the second quarter, which had been fully expected and priced in. Prices jumped to the highest in two weeks amid hopes for a pickup in demand, closing above the 55-day moving average for the first time since April 30.
Speculative positioning was the most bearish since June 2016, the latest data to July 9 from CFTC showed, and the rebound could force some liquidation of those shorts in next week’s data.
Copper Daily Chart

Agriculturals
SOYBEANS posted the biggest weekly gain in four weeks last week as news broke that the US-China trade negotiations were restarting. Prices hit the high for the month before retreating and are now facing the second down-day in a row.
China reported that imports of US soybeans were lower than expected in June, despite US claims that that China had agreed to buy more agricultural products. June imports were down 11.5% year-on-year and the lowest since 2014 as the trade war and swine fever had an impact. A recent US Department of Agriculture (USDA) report estimated that Brazil’s portion of China soy imports could be as high as 75% for this season, up from just 30% in the 2016/17 season.
Speculative investors remain bearish on the commodity, however, as they increased their net short positions for the first time in eight weeks, according to the CFTC data. Investors have been carrying net short positions since February, with prices since than suffering a 12.8% drop into May followed by a strong rebound to be just 1.56% below February levels at the moment.
CORN prices rose to a one-month high yesterday before reversing to post the biggest one-day loss this month. The commodity had found some weather-related buying interest amid concerns that hot, dry weather across the US corn-belt could damage crops. Speculative accounts remain bullish, with the latest data showing net long positions hovering near 13-month highs.
SUGAR looks set to decline for a third straight week this week and has traded below the 55-week moving average for the first time since early-June. Oversupply remains a concern for corn traders, with the latest World Agricultural Supply and Demand Estimates (WASDE) report from the USDA forecasting that sugar stocks at the end of the 2018/19 season would be 1.76 million tons, a 15% upward revision from its June forecast. Its forecast for the end of the 2019/20 season was raised 9% to 1.66 million tons, but at least it is still lower than the 2018/19 estimate.
Speculative accounts were net buyers for a sixth week to July 9, according to the latest data snapshot from CFTC. Net longs are now the highest since the week of April 23.
WHEAT prices have been on a downward trajectory for the past three weeks and are falling toward the 55-week moving average at 4.9324. Wheat has declined further this week and looks poised for the biggest weekly loss since April. Speculative investors scaled back their net long positions for the first time in 10 weeks in the week to July 9, CFTC data showed.
