The strong jobs report last Friday boosted risk appetite to the detriment of safe havens but lifted oil prices. The agricultural sector is mixed ahead of today’s World Agricultural Supply and Demand Estimates (WASDE) report from the U.S. Department of Agriculture.
Precious metals
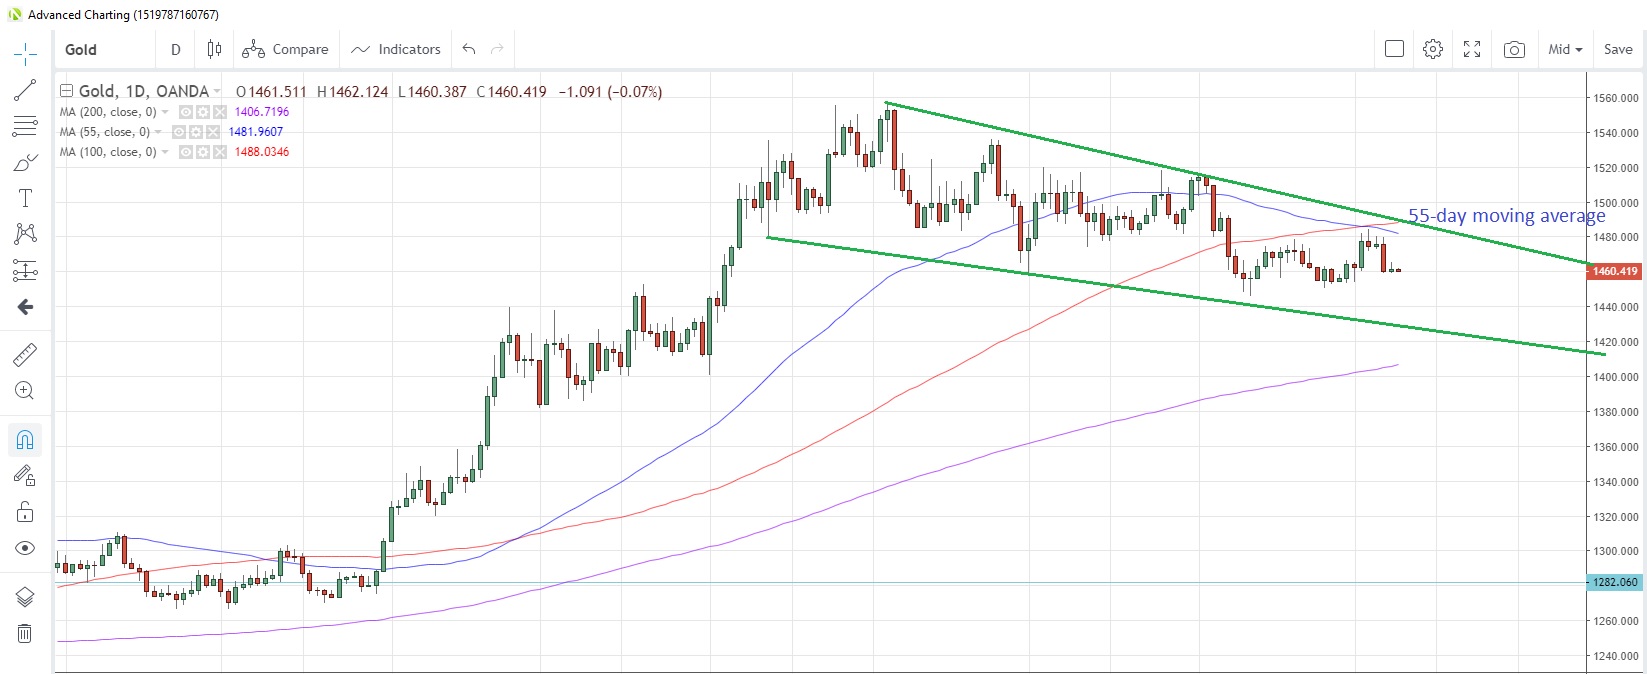
GOLD prices fell the most in a month last Friday after the U.S. jobs report showed 266,000 jobs had been added in November, the biggest monthly gain since January. The decline meant that the precious metal remained capped by the 55-day moving average at 1,481.98 since November 5. China’s gold reserves stabilized at 62.6 million ounces at the end of November, according to the People’s Bank of China website.
Speculative investors boosted net long positioning to levels not seen since the week of September 24 in the week to December 3, according to the latest data snapshot from CFTC. Gold has been stuck in a downward-sloping channel which began from September 4 which has upper and lower parameters of 1,490 and 1,430, respectively today.
Gold Daily Chart

SILVER suffered the biggest weekly loss in four weeks last week, echoing gold’s decline as precious metals fell out of favour. The metal is currently sitting on the 200-week moving average at 16.5786, which was breached on a closing basis last week for the first time since July.
Exchange-traded funds (ETFs) added 172,000 ounces of silver to physical holdings in the latest trading session, bringing total purchases for this year to 88.6 million ounces, according to a Bloomberg report yesterday. Speculative accounts turned net sellers of silver for the first time in three weeks in the week to December 3, CFTC data show.
PLATINUM is gradually trading into the apex of a triangle formation that has been building since November 21. The base of the triangle is around the 886.10 level while the 55-day moving average looks as if it’s about to cross below the 100-day moving average at 899.34. Speculative investors remain ever positive for an upside breakout as they increased net long positions for a third week in the latest reporting week.
PALLADIUM continues to press on to record levels, seemingly on a daily basis, as the natural shortfall in global supply prompts steady buying. Speculative investors are net bullish on the metal, having boosted net long positions to the highest in five weeks, according to the latest data snapshot from CFTC.
Base metals
COPPER advanced to levels not seen since July 22 yesterday, building on excessive gains made Friday on the back of the strong U.S. jobs report. In addition, last Friday China announced a host of infrastructure plans following a Politburo meeting, which has lifted anticipated demand for industrial metal. China’s imports data released last Sunday also suggested a steady demand for the metal as the country’s copper imports hit a record last month.
Copper stocks at warehouses monitored by the London Metal Exchange (LME) were at the lowest level in nine months as at last Friday. The combination of low stocks and increasing demand could be bullish for the metal.
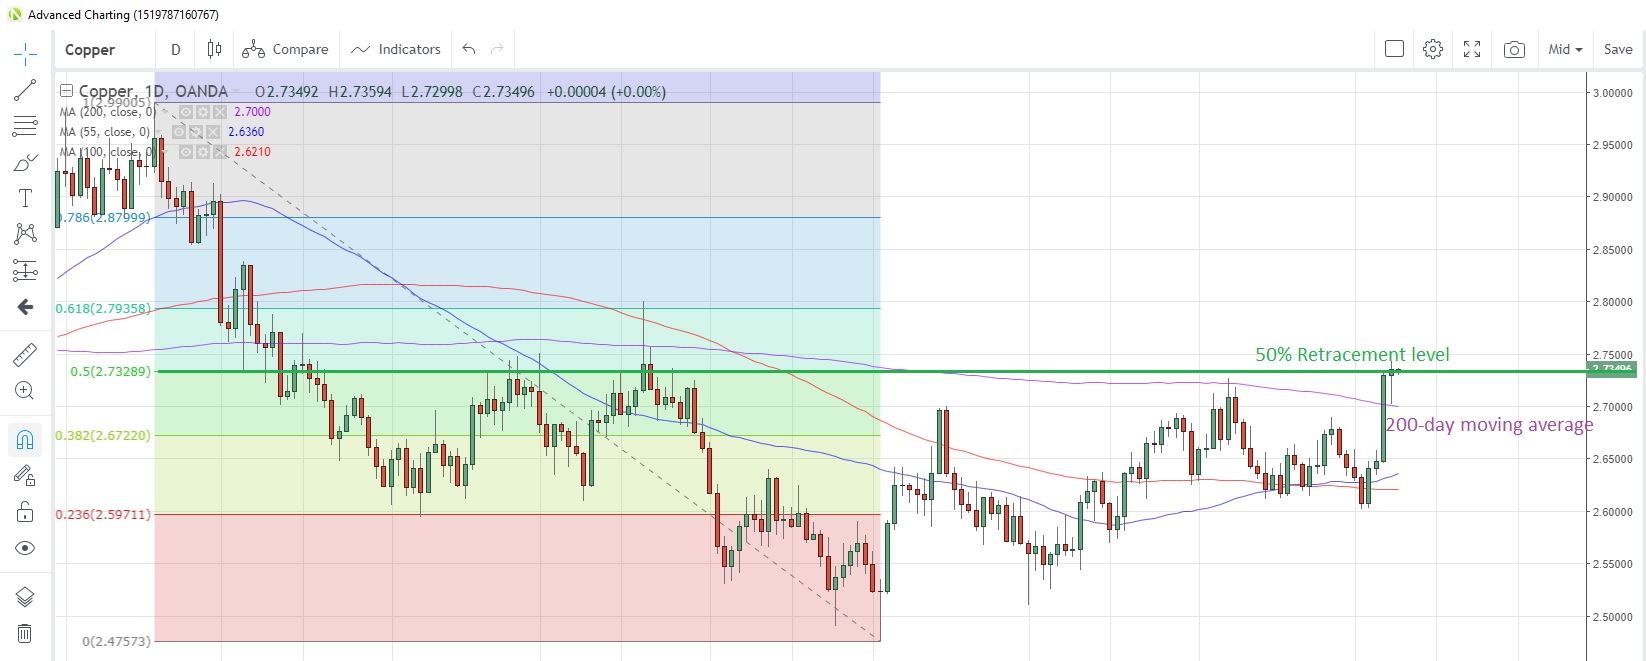
Copper closed above the 200-day moving average at 2.7017 on Friday for the first time in six months and is currently testing the 50% retracement level of the April-September drop at 2.7329.
Copper Daily Chart

Energy
CRUDE OIL prices rose the most since mid-June last week after OPEC announced a cut in overall production by an additional 500,000 barrels per day (bpd) through to March 2020, bringing the total curtailment to 1.7 million barrels per day. After the meeting, Saudi Arabia announced an additional voluntary cut of 400,000 bpd, which help lift West Texas Intermediate to six-month highs.
Subsequently, investment bank Goldman Sachs (NYSE:GS) raised its 2020 forecast for Brent crude to $63 per barrel from $60 previously (Brent is currently trading at $64.84).
The number of U.S. oil rigs in production declined for a seventh straight week last week and they are now at the lowest since March 2017. Speculative investors had reduced net long positions for the first time in eight weeks in the run-up to the OPEC meeting.
NATURAL GAS prices slumped to the lowest levels since August 26 yesterday amid a dismal demand outlook. Warmer-than-normal weather forecasts for Europe and the U.S. South next week has put pressure on prices for the past three sessions. Speculative investors are most bearish on the commodity since September 2015, the latest data from CFTC show.
Agriculturals
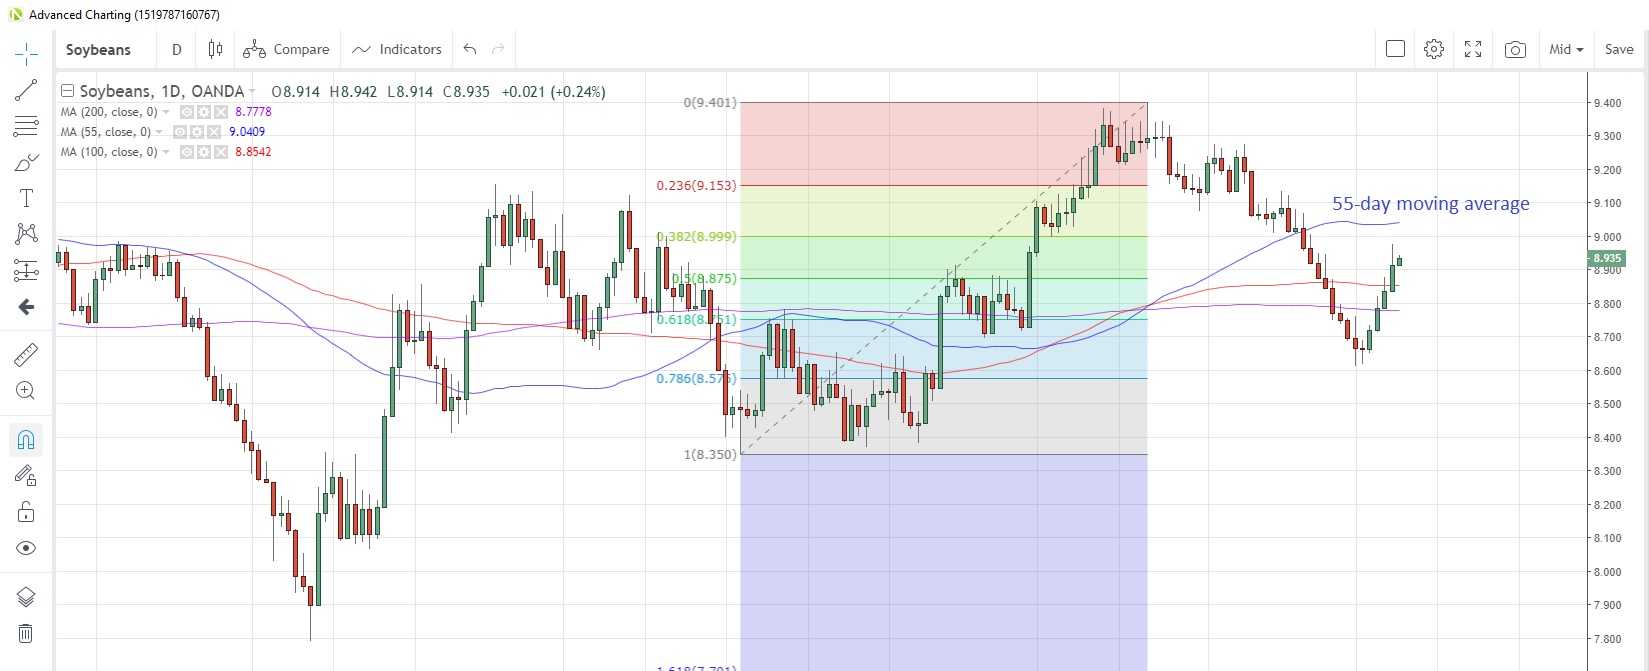
SOYBEANS look set to post gains for a fifth consecutive day today after touching the highest level since November 21 yesterday. The commodity is benefiting from higher Chinese imports, with the latest customs data showing imports at the highest in three months in November as more shipments from the U.S. were cleared. Soybeans are back above the 100-day moving average at 8.854 and are heading toward the 55-day moving average at 9.041.
Speculative investors were net sellers of the commodity for a fifth straight week to December 3, the latest CFTC data show. Positioning turned net short for the first time since the week of September 17.
Soybeans Daily Chart

SUGAR rallied for a fifth day yesterday, the longest winning streak since September, and hit the highest level since end-February. Analysts are still anticipating a global shortfall in supply for this season, which is putting upward pressure on prices. Speculative accounts were net buyers for a sixth consecutive week and trimmed net short positions to the least since the week of July 16.
The 55-day moving average looks set to cross above the 200-day moving average at 0.1197 later this week, which would be the first time since June 19.
CORN is holding below the 55-day moving average at 3.7544, which has capped prices since November 15. There’s hasn’t been much in the way of headlines this past week, so prices have traded within tight ranges. Speculative accounts have scaled back net short positions to the lowest since early-September, according to the latest report from CFTC.
WHEAT snapped a two-week rising streak last week and has drifted lower again this week. Warmer weather in China is expected to benefit China’s winter crop and thus increasing the supply side. Speculative investors were net buyers for a third week to December 3, lifting net long positions to the highest since the week of July 30.
