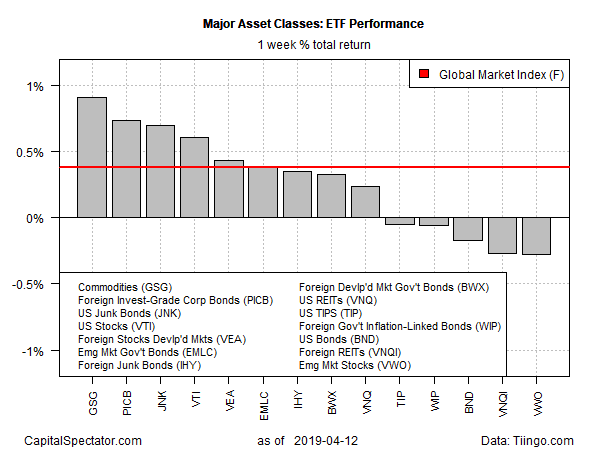
A broad measure of commodities rose last week, posting the strongest increase for the major asset classes, based on a set of exchange-traded funds. The rally marks the second straight week with commodities leading markets higher.
iShares S&P GSCI Commodity-Indexed (NYSE:GSG) rose 0.9% for the trading week ended Apr. 12. The ETF’s advance reflects a sixth straight weekly increase, settling at its highest close since November.
Most of the major asset classes rose last week, but some markets lost ground. The biggest setback: emerging market stocks. Vanguard FTSE Emerging Markets (VWO) slipped fractionally, easing 0.3%. Despite the setback, the fund remains close to its highest close since last June.
Overall, a clear upside bias was conspicuous in last week’s trading activity. An ETF-based version of the Global Markets Index (GMI.F) – an investable, unmanaged benchmark that holds all the major asset classes (except cash) in market-value weights — rose for a third week, increasing 0.3%.
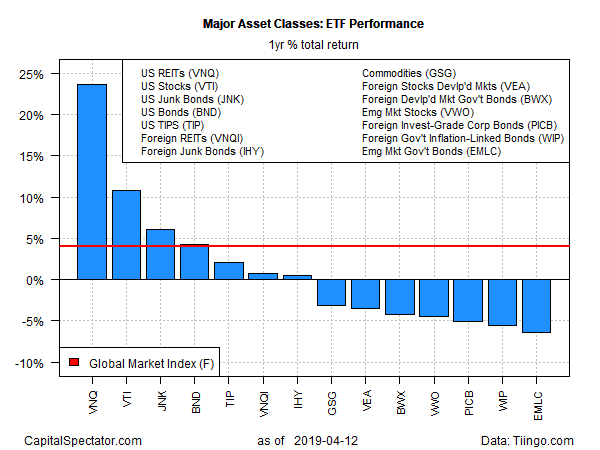
For the one-year trend (252 trading days), real estate investment trusts (REITs) in the US continue to dominate the performance horse race by a wide margin. Vanguard Real Estate (VNQ) closed last week with a strong 23.7% total return. The performance is far ahead of the second-best one-year performer: US stocks via Vanguard Total Stock Market (VTI), which is up 10.8% from its year-ago level.
The weakest performer for the major asset classes over the trailing one-year window: bonds issued by governments in emerging markets. VanEck Vectors J.P. Morgan EM Local Currency Bond (EMLC) is down 6.4% for the year through Friday’s close.
GMI.F’s one-year performance is a moderate 4.0% gain.
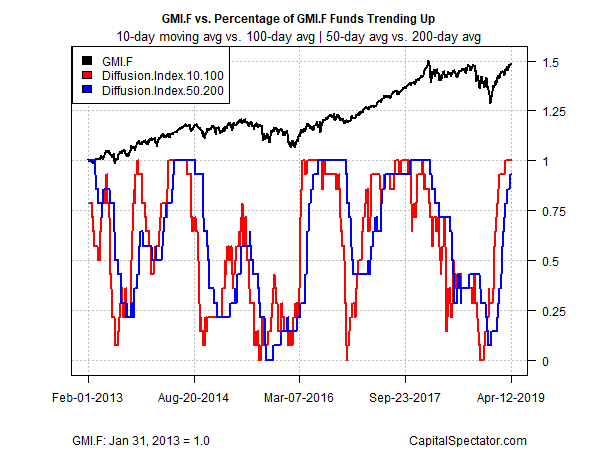
Last week’s broad-based gains continued to strengthen the upside momentum profile for the major asset classes overall, based on two sets of moving averages for the ETFs listed above. The first definition compares the 10-day moving with the 100-day average, providing a profile of short-term trending behavior (red line in chart below). A second set of moving averages (50 and 200 days) offers an intermediate measure of the trend (blue line). The indexes range from 0 (all funds trending down) to 1.0 (all funds trending up). Based on data as of last week’s close, bullish momentum remains robust across the major asset classes.