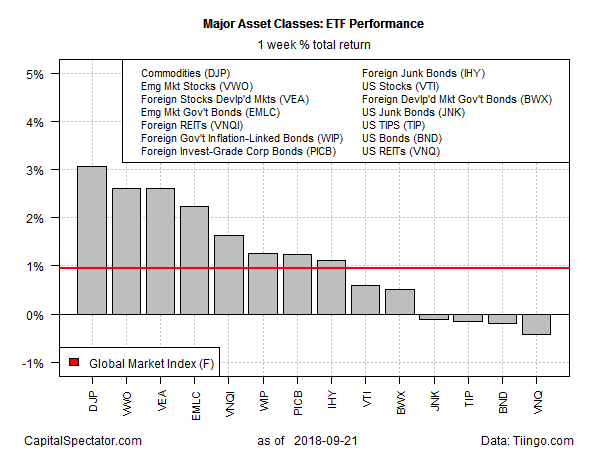
Broadly defined commodities surged over the five trading days through Friday, September 21, posting last week’s strongest gain for the major asset classes, based on a set of exchange-traded products. Foreign stocks in developed and emerging markets accompanied the commodities rally, delivering the second- and third-highest gains, respectively.
The iPath Bloomberg Commodity Total Return (DJP) popped 3.1% last week, marking its biggest weekly advance since April. Key factors in last week’s rally: perceptions that tensions are easing in the US-China trade war and a weaker dollar. The US Dollar Index slumped for a second week, closing on Friday near its lowest level since July.
Maintaining an upbeat outlook on commodities may become challenged anew this week, however, as the US and China impose new trade tariffs on each other today. Meantime, China says it’s calling off any trade negotiations with the US for now, a decision that threaten to raise economic tensions between the two nations.
“The trade war is now a reality,” said Brian Coulton, chief economist at Fitch Ratings. “The recently announced imposition of US tariffs on a further $200 billion of imports from China will have a material impact on global growth and, even though we have now included the 25% tariff shock in our GEO [Global Economic Outlook] baseline, the downside risks to our global growth forecasts have also increased.”
Last week’s biggest loser: real estate investment trusts (REITs) in the US. As expectations strengthened for another rise in interest rates by the Federal Reserve this week (the central bank’s policy announcement is due on Wed., Sep 26), rate-sensitive REITs took a hit. Vanguard Real Estate (VNQ) eased 0.4%, slipping to its lowest weekly close since early August.
The broad trend for assets overall, based on an ETF-based version of the Global Markets Index (GMI.F), remained positive. This investable, unmanaged benchmark that holds all the major asset classes in market-value weights edged up for a second week, gaining 0.9% for the five trading days through Friday.

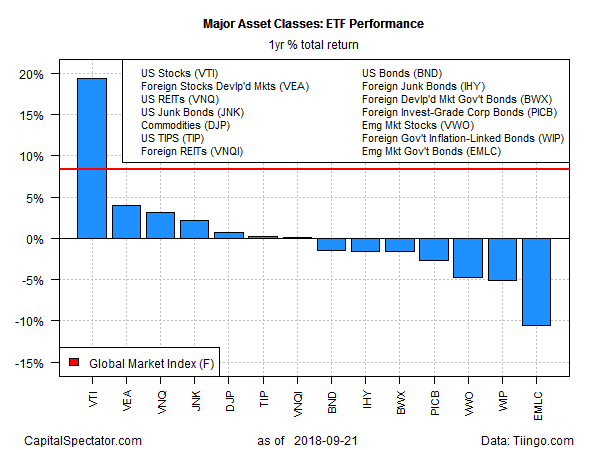
For the one-year trend, US stocks continue to lead the field by a hefty degree. Vanguard Total Stock Market (VTI) closed last week with a 19.4% total return for the trailing 12-month period – well above the other slices of the major asset classes.
The biggest one-year loss is currently found in government bonds issued by emerging markets. VanEck Vectors JP Morgan Emerging Local Currency Bond (EMLC) has lost 10.5% through Friday’s close vs. the year-earlier price, based on total return.
Meanwhile, GMI.F is up 8.4% over the past year in total-return terms – a gain that exceeds everything save the US stock market for the trailing one-year window.

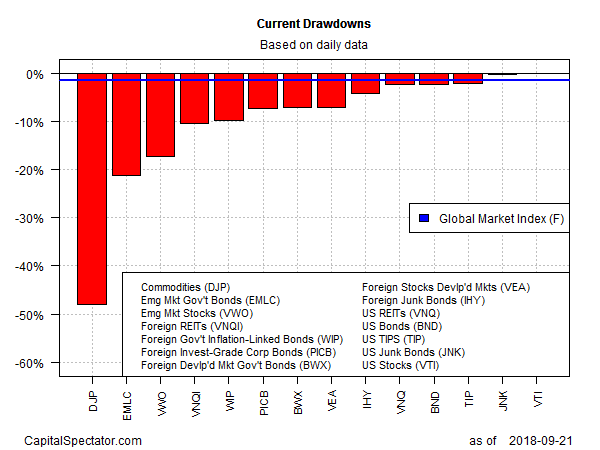
Finally, broadly defined commodities continue to post the biggest slide from the previous peak. The iPath Bloomberg Commodity (DJP) is currently reporting a drawdown of nearly 50%. Meanwhile, the smallest peak-to-trough decline for the major asset classes is in US equities: Vanguard Total Stock Market (VTI) ended last week at fraction below a record high.
GMI.F’s current drawdown is also relatively light at the moment at just -1.4%.

