Tuesday was another ugly open for the S&P 500 as overnight weakness in Asia and Europe pressured US markets. We crashed lower at the open and undercut this selloff’s prior lows near 2,710. But rather than trigger another avalanche of defensive selling, that early dip was as bad as it got. Supply of nervous sellers dried up after the first hour of trade and we recovered a majority of the losses by the close. Not very often does a 0.5% loss feel like a good thing, but that is what happened yesterday.
Even though Trump’s tariffs haven’t done much harm to our economy, they are strangling the already weak Asian economies, most notably China. While this is Trump’s desired outcome, global markets are more intertwined than ever and what hurts one is felt by everyone else. By taking down China, Trump is indirectly taking down our markets.
The biggest question is what comes next. Is the worst already behind us? Or are we on the verge of another tumble lower? I wish I knew for sure, but the best we can do is figure out the odds and make an intelligent trade based on the most likely outcome. For that, a look back at history is the most logical place to start.
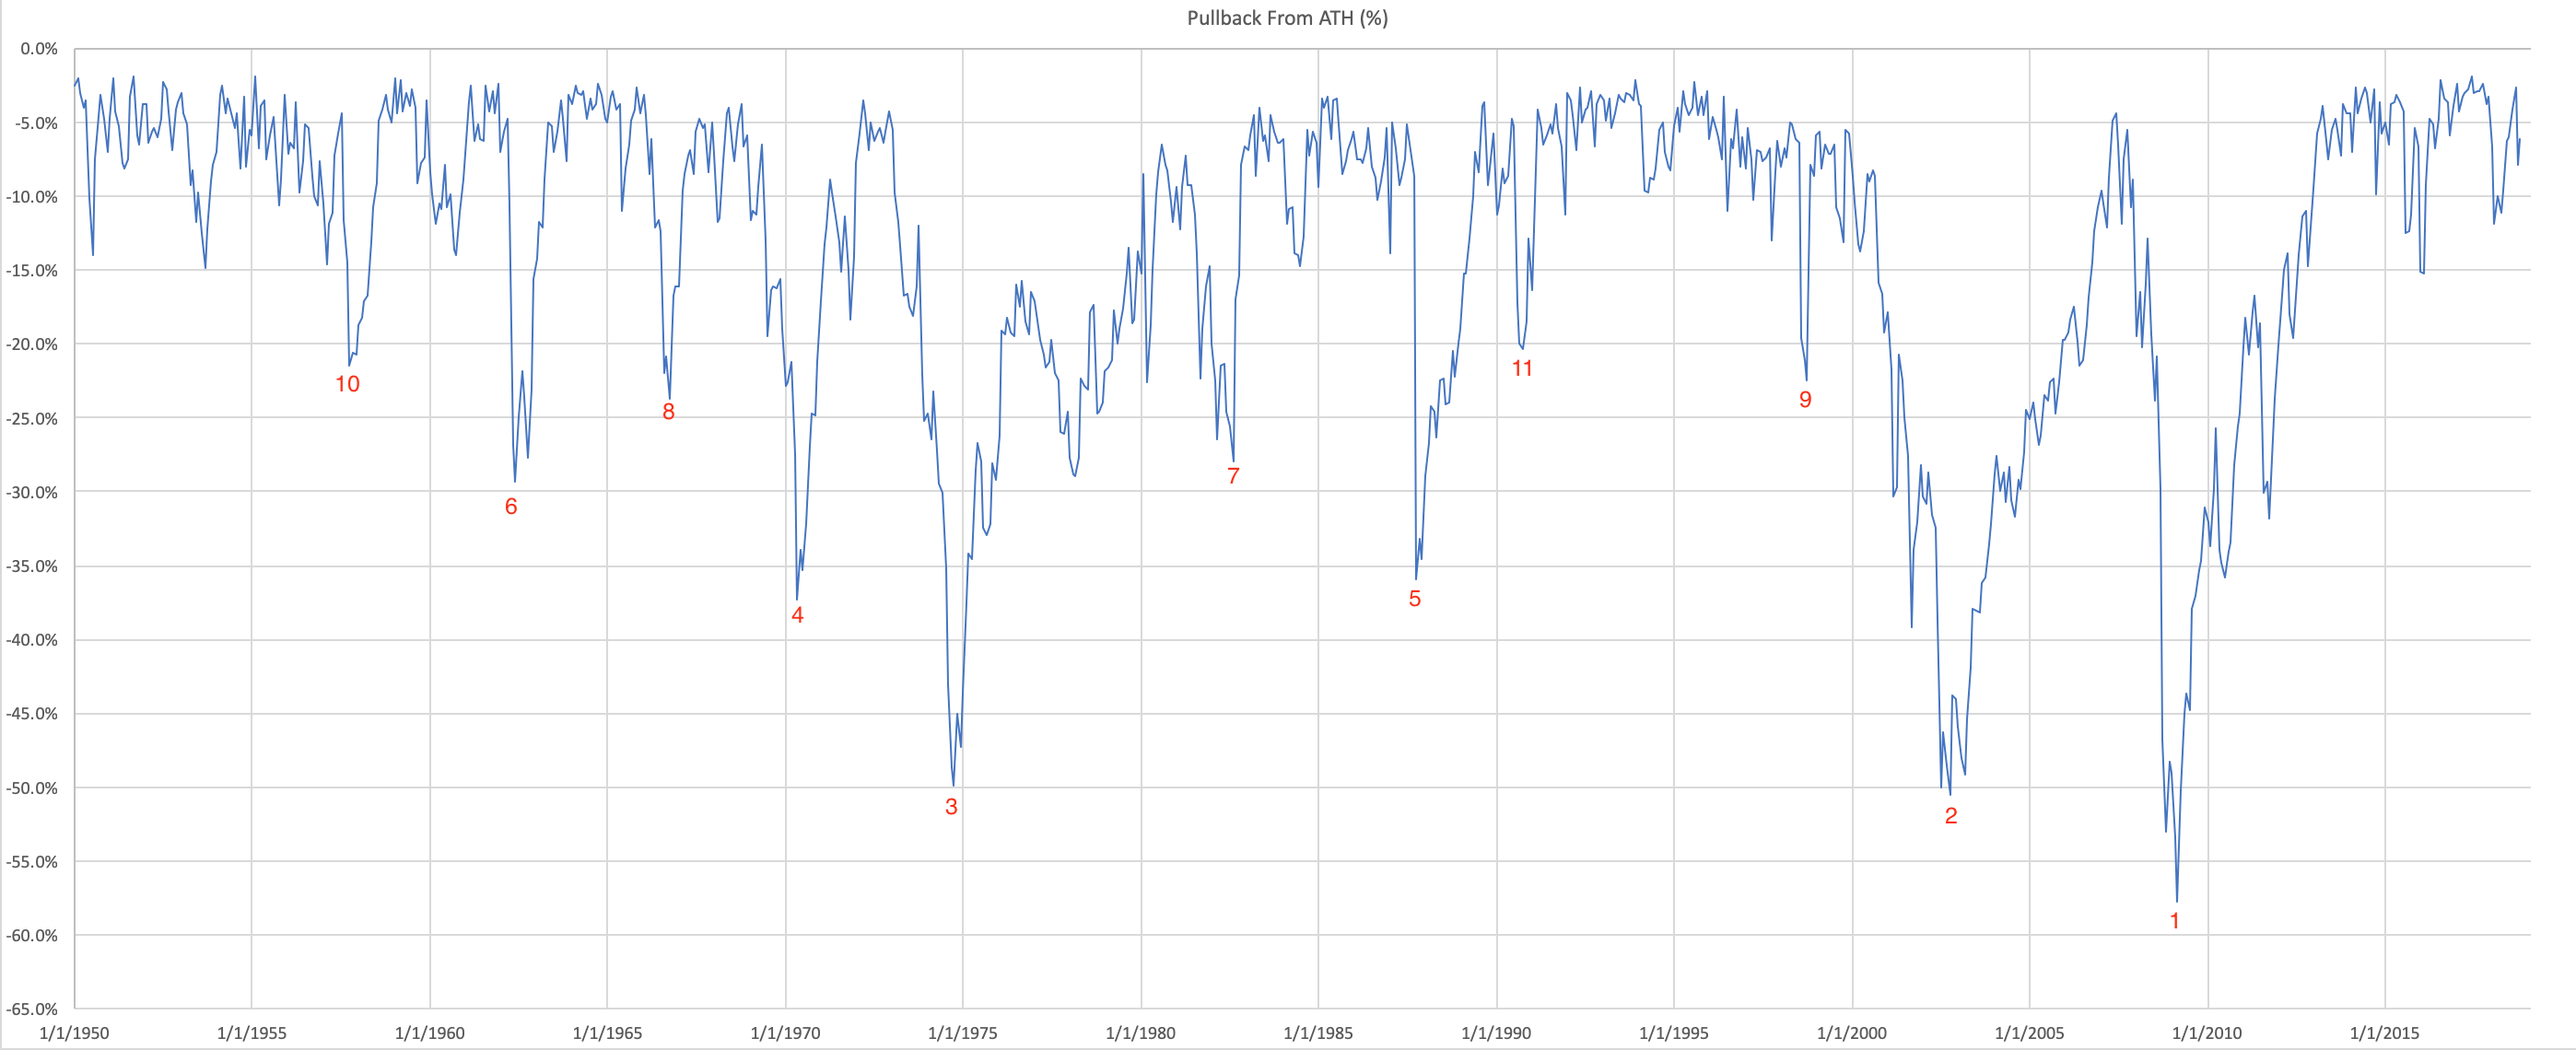
The above chart shows pullbacks in the S&P 500 from all-time highs since January 1950. That gives us nearly 70 years worth of data to analyze.
One of the most notable things is how rare big selloffs really are. Over the last 69 years, only 11 times have prices tumbled more than 15% from the highs. We often think of big crashes like 1987, the Financial Crisis, or the Dot-Com bubble. But those events are exceedingly rare. All the other pullbacks over the last 69 years have been 15% or less. While 15% is a lot, it isn’t terrifying. And even better, all of those under 15% pullbacks were erased within a few months. Small and short. That sounds like something we can live with.
Currently we find ourselves 7% from the highs. Those losses are already behind us and we cannot do anything about them. But we can prepare for what comes next. Assuming we are not on the verge of another Financial Crisis or similar catastrophe, the most likely outcome is a dip smaller than 15%. From current levels, that is another 8%. But that is the worst case. The actual dip will most likely be smaller than 15%.
Over the last 69 years, the S&P 500 has tumbled between 10% and 15% 22 times. That’s about once every three years. Not unheard of, but not common either. The last pullbacks of this size were 15% in 2016 and 12% earlier this year. Are we due for another one? Maybe. But it definitely doesn’t seem like we are overdue given we already had two over the last two years.
More common are pullbacks between 5% and 10%. There have been 36 of these over the last 69 years, meaning these happen every year or two. From 7%, that means we could be as little as 1% or 2% from the bottom. And even better is most of these 15% or smaller pullbacks return to the highs within a few months.
We are down 7% and there is nothing we can do about that. But going forward we have a decent probability of only slipping a little further. And assuming the world doesn’t collapse, worst case is another 8%. While that wouldn’t be any fun, is that really worth panicking over?
The price action has been weak the last few days and that led to yesterday’s weak open. And the market loves double-bottoms, meaning we could see a little more near-term weakness. But what is a little more downside if we will be back at the highs in the next month? While I cannot say the bottom is in yet, the odds are definitely lining up behind buying this market, not selling it.
