
The Clorox Company (NYSE:CLX) reported first-quarter fiscal 2020 results, wherein earnings beat estimates but sales lagged. However, top and bottom lines declined year over year. Further, the company reiterated its recently lowered view for fiscal 2020, based on revised assumptions for currency rates.
Shares of the Zacks Rank #4 (Sell) company have declined 4.2% year to date against the industry’s 23.4% growth.

Q1 Highlights
Quarterly earnings from continuing operations of $1.59 per share dipped nearly 2% year over year but beat the Zacks Consensus Estimate of $1.54. The bottom-line beat can be attributed to gains from cost savings and price increases. However, the gains were marred by higher trade promotion spending as well as increased manufacturing and logistics costs, and unfavorable currency rates.
The Clorox Company Price, Consensus and EPS Surprise
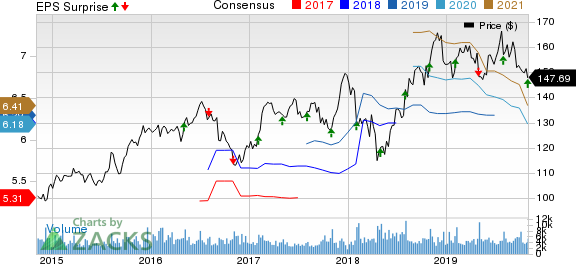
The Clorox Company price-consensus-eps-surprise-chart | The Clorox Company Quote
Net sales of $1,506 million declined nearly 4% year over year and missed the Zacks Consensus Estimate of $1,512 million. Further, sales declined 2% on an organic basis. The soft top-line result was caused by higher trade promotion spending and unfavorable mix as well as effects of unfavorable currency. This was partially offset by gains from price increases. Currency headwinds hurt sales by nearly 2 percentage points.
Driven by the recent price increases and cost savings, Clorox witnessed gross margin expansion of 60 bps to 44% in the fiscal first quarter. However, the aforementioned gains were partly negated by elevated trade spending, and manufacturing and logistics expenses.
Segmental Discussion
Sales of the Cleaning segment dipped 2% to $562 million on declines in Laundry and Home Care businesses along with an unfavorable mix that resulted from sturdy growth in non-tracked channels. However, strength in the Professional Products business partly cushioned the decline.
The Household segment’s sales declined 14% to $381 million mainly due to declines in Charcoal, and Bags and Wraps businesses. Bags and Wraps sales were impacted by larger price gaps compared with the year-ago quarter as well as distribution losses. Further, the Charcoal business delivered soft sales due to increased trade promotional spending to manage inventory levels before the 2020 grilling season.
Sales at the Lifestyle segment rose 4% to $322 million. Results were aided by growth in the Natural Personal Care business, driven by innovation in Lip Care and Face Care categories.
At the International segment, sales remained flat with the year-ago quarter at $241 million. Organic sales for the segment rose 8%, driven by strong gains in Latin America and Asia, partly offset by adverse currency rates.
Financials
Clorox ended the fiscal first quarter with cash and cash equivalents of $150 million, and long-term debt of $2,287 million. In first-quarter fiscal 2020, the company generated $271 million of net cash from continuing operations.
Fiscal 2020 Guidance
Clorox reiterated its outlook for fiscal 2020, which was lowered on revised assumptions of foreign currency rates on Oct 2. The company projects sales between low-single digits decline and up 1% in fiscal 2020, reflecting about 2 percentage points of currency headwinds. However, it continues to estimate organic sales growth of 1-3%. The company’s organic sales view is backed by its robust innovation program and previously stated expectation of returning Charcoal, and Bags and Wraps businesses to growth in the second half of fiscal 2020.
Gross margin is estimated to be slightly down in fiscal 2020. Advertising and sales promotion spending is anticipated to be roughly 10% of sales. Selling and administrative expenses are projected to be nearly 14% of sales. The company envisions effective tax rate of 22-23% for fiscal 2020. Consequently, management anticipates earnings per share of $6.05-$6.25 for fiscal 2020.
3 Better-Ranked Stocks to Watch
The Procter & Gamble Company (NYSE:PG) has a long-term earnings growth rate of 7.2%. It currently carries a Zacks Rank #2 (Buy). You can see the complete list of today’s Zacks #1 Rank (Strong Buy) stocks here.
Church & Dwight Co., Inc (NYSE:CHD) presently has a long-term earnings growth rate of 8.8% and a Zacks Rank #2.
Helen of Troy Limited (NASDAQ:HELE) currently has a long-term earnings growth rate of 7.6% and a Zacks Rank #2.
(We are reissuing this article to correct a mistake. The original article, issued on October 31, 2019, should no longer be relied upon.)
Helen of Troy Limited (HELE): Free Stock Analysis Report
Procter & Gamble Company (The) (PG): Free Stock Analysis Report
The Clorox Company (CLX): Free Stock Analysis Report
Church & Dwight Co., Inc. (CHD): Free Stock Analysis Report
Original post
Zacks Investment Research