For those of you reading this analysis who are perhaps unfamiliar with the term, pump and dump, let me briefly explain. It is a slang term used to describe how naive investors are lured into buying worthless stocks at high prices, and is a technique employed by all the best boiler room scam operators. It is very simple and very effective and premised on convincing those naive enough to believe that a stock they have never heard of is about to skyrocket for some quick and easy profits.
Needless to say, once the stock is purchased, pumped up by the hype and the operators having sold out, the price promptly collapses. Strangely enough the same technique is employed by market insiders and operators. Yesterday we saw a classic example clinically executed in gold futures.
Regular readers will know that for some weeks I have been wary of the move higher in gold, and on two occasions suggested there was a trap up move being set. Yesterday the trap door was released with the collapse in the price of gold which has lost over $30 per ounce on the day. No doubt it culminated in a blood bath for those traders who did not incorporate volume price analysis into their trading methodology.
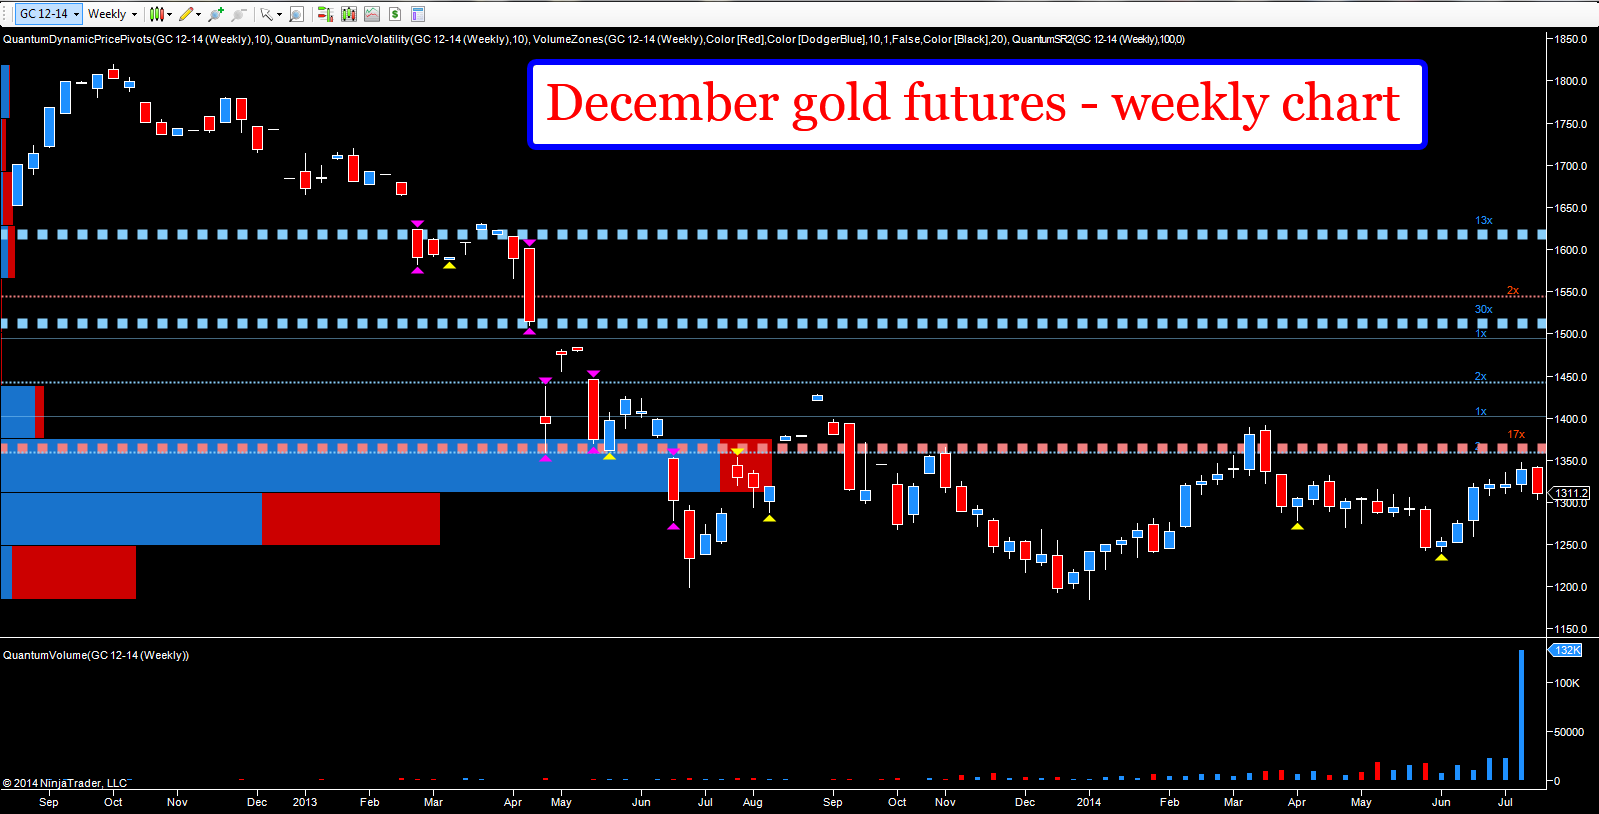
Had they done so, they would have seen, as I did, a text book example of a volume price anomaly, which even Mr. Magoo would have had difficulty missing. This is volume price analysis 101, where we have extreme levels of volume on the weekly chart with a consequent narrow spread of price action. On such high volumes, the market should have risen, yet it did not. The conclusion is clear and obvious – this is selling volume from the big money, and it is not a question of if a market is going to reverse but simply when. And the initial phase of this reversal was duly delivered in yesterday’s gold trading session.
In addition to the volume price scenario, the deep resistance overhead at the $1360 per ounce price region also played its part in yesterday’s carnage. This price area is now both deep and wide, and as a result we are likely to see a similar pattern unfold as we saw in early March, with gold retracing from this level back to test the $1240 per ounce region.
Given the extent of the shift in volume in last week’s gold trading session, the retrace on this occasion is likely to be deeper and more sustained, and we could well see gold prices move back below $1200 per ounce and test the $1180 region of late 2013 in the medium term.

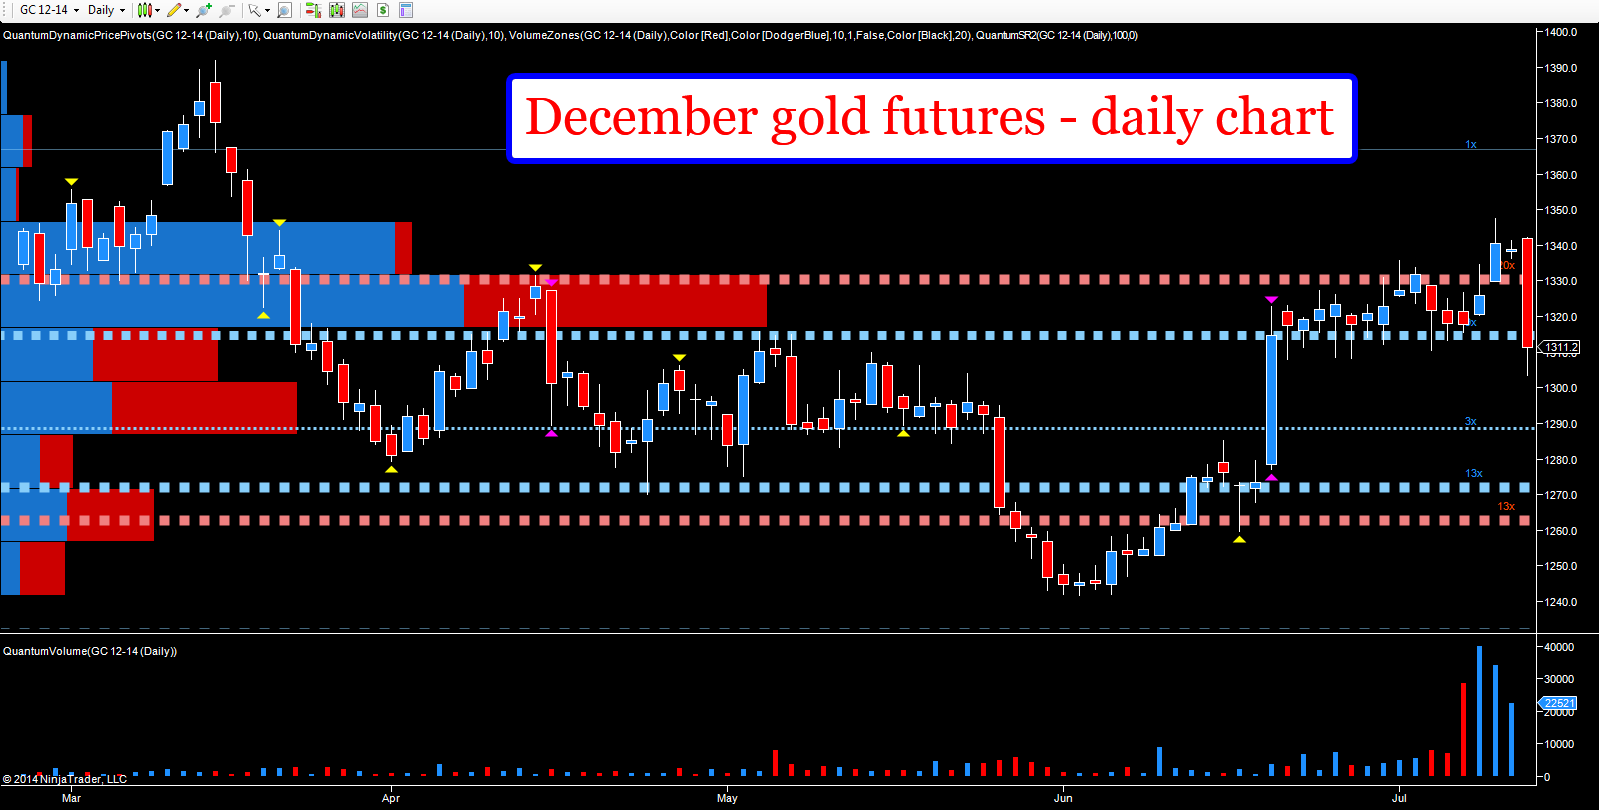
Moving to the daily chart, the end of last week was characterized with extreme volume driven by fear, yet with no significant price move higher associated with this level of activity. In addition, the volume here is falling, once again signalling an end to the current trend higher. As we can see on the daily chart, gold has just breached the platform of support at the $1315 per ounce region with the next level at $1275 followed by another at $1265. If both these are breached (as expected) then gold is likely to move through $1240 and further down, as outlined above.
Finally the reason given for this dramatic sell-off is that confidence has returned and the problems in Portugal were overstated. This is what the media will tell you as it is a simple and quick sound byte. After all, no-one would believe that pump and dump is alive and well in the gold futures market today – would they?
