
Cintas Corporation (NASDAQ:CTAS) delivered better-than-expected results for the third quarter of fiscal 2020 (ended Feb 29, 2020). It recorded earnings beat of 6.93% and sales beat of 0.81% in the quarter under review.
The company’s adjusted earnings in the reported quarter were $2.16 per share, which surpassed the Zacks Consensus Estimate of $2.02. On a year-over-year basis, the bottom line increased 17.4% from the year-ago figure of $1.84 on healthy segmental business and margin improvement.
Segmental Sales
In the quarter under review, Cintas’ net sales were $1,810.6 million, reflecting growth of 7.6% from the year-ago quarter. The improvement was driven primarily by organic sales growth of 5.7%.
Further, the top line surpassed the Zacks Consensus Estimate of $1,796 million.
Cintas Corporation Price, Consensus and EPS Surprise
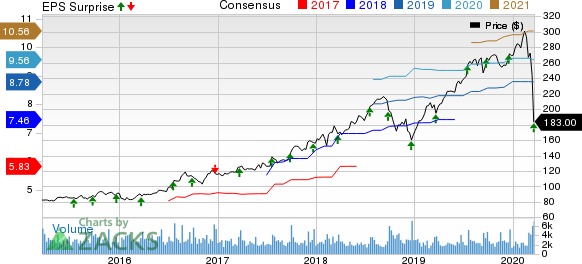
Cintas Corporation price-consensus-eps-surprise-chart | Cintas Corporation Quote
The company has two reportable segments — Uniform Rental and Facility Services, and First Aid and Safety Services. Other businesses like Uniform Direct Sale and Fire Protection Services are included in All Other. Quarterly sales data is briefly discussed below.
Revenues from the Uniform Rental and Facility Services segment (representing 80% of the reported quarter’s net sales) were $1,448 million, up 6.6% year over year. Organic sales were recorded at 4.8%.
Revenues from the First Aid and Safety Services segment (representing 9.4% of the reported quarter’s net sales) totaled $170.5 million, up 14.3% year over year. Organic sales in the quarter increased 12.5%.
Revenues from the All Other business (representing 10.6% of the reported quarter’s net sales) were $192.1 million, up 9.9% year over year.
Gross Margin
In the quarter under review, Cintas’ cost of sales (comprising costs related to uniform rental and facility services as well as others) increased 6.4% year over year to $986.2 million. It represented 54.5% of net sales compared with 55.1% in the year-ago quarter. Gross profit in the quarter increased 9.2% year over year and gross margin was up 60 basis points (bps) to 45.5%.
Selling and administrative expenses totaled $509.7 million, reflecting a 7.1% increase over the year-ago figure. It represented 28.2% of net sales. Operating margin in the quarter expanded 90 bps year over year to 17.4%.
Balance Sheet and Cash Flow
Exiting the quarter, Cintas’ cash and cash equivalents were $234.4 million, up 3.5% from $226.5 million at the end of the previous quarter. Long-term debt increased marginally, sequentially, to $2,539.2 million.
In the first nine months of fiscal 2020, the company generated net cash of $934.5 million from operating activities, up 39.3% from the year-ago figure. Capital expenditure totaled $189.4 million, reflecting a year-over-year decline of 8.9%. Free cash flow surged 61% year over year to $745.2 million.
During the first nine months of fiscal 2020, the company repurchased shares worth $261.3 million.
Outlook
Due to the severity and uncertainty of the coronavirus pandemic, Cintas has not provided any guidance for the fourth quarter of fiscal 2020 (ending May 2020) and has withdrawn the same for fiscal 2020 (ending May 2020).
Zacks Rank & Stocks to Consider
With a market capitalization of approximately $19 billion, Cintas currently carries a Zacks Rank #3 (Hold).
Some better-ranked stocks are Graco Inc. (NYSE:GGG) , Tennant Company (NYSE:TNC) and Broadwind Energy, Inc. (NASDAQ:BWEN) . While Graco and Tennant sport a Zacks Rank #1 (Strong Buy), Broadwind Energy carries a Zacks Rank #2 (Buy). You can see the complete list of today’s Zacks #1 Rank stocks here.
Graco delivered positive earnings surprise of 0.40%, on average, in the trailing four quarters.
Tennant delivered positive earnings surprise of 26.60%, on average, in the trailing four quarters.
Broadwind Energy delivered positive earnings surprise of 10.42%, on average, in the trailing four quarters.
Today's Best Stocks from Zacks
Would you like to see the updated picks from our best market-beating strategies? From 2017 through 2019, while the S&P 500 gained and impressive +53.6%, five of our strategies returned +65.8%, +97.1%, +118.0%, +175.7% and even +186.7%.
This outperformance has not just been a recent phenomenon. From 2000 – 2019, while the S&P averaged +6.0% per year, our top strategies averaged up to +54.7% per year.
See their latest picks free >>
Cintas Corporation (CTAS): Free Stock Analysis Report
Graco Inc. (GGG): Free Stock Analysis Report
Tennant Company (TNC): Free Stock Analysis Report
Broadwind Energy, Inc. (BWEN): Free Stock Analysis Report
Original post
Zacks Investment Research