• China’s manufacturing PMI stays below the boom-or-bust level of 50. China’s manufacturing sector contracted for the eight straight month in October but at a slower pace. The Caixin manufacturing PMI edged up a bit to 48.3 from 47.2 previously, but stayed below the 50 mark dividing expansion from contraction. Coming on top of the official PMI released during the weekend, the soft readings reinforced the view that business conditions in China are continuing to deteriorate. Further contraction in activity raises concerns about whether the economy could see a modest recovery in Q4. As a result, we would expect the AUD and NZD to remain under pressure.
• Turkey election Turkey's ruling Justice and Development Party (AKP) has won the country’s parliamentary election, regaining the majority it lost in June. Months of political uncertainty, caused by the failure of coalition talks in the wake of an inconclusive election in June, had hurt the Turkish lira. Now that the uncertainty has decreased after these elections results, the outcome could favor the TRY at least in the short-run.
• Today’s highlights: During the European day, we get the final manufacturing PMIs for October from several European countries and the Eurozone as a whole. As usual, the final forecasts are the same as the initial estimates, thus the market reaction on these news is usually limited, unless we have a huge revision from the preliminary figures. The UK manufacturing PMI for the same month is expected to have declined for the third consecutive month, which could prove GBP-negative.
• In the US, the ISM manufacturing PMI and the final Markit manufacturing PMI, both for October are also due out. The market pays more attention to the ISM index, which is expected to have declined to its equilibrium level. A slight dip below 50 will be the first time the index will show contraction since November 2012. This could hurt the greenback.
• As for the speakers, Fed Chair Janet Yellen participates at the Financial Stability Oversight Council meeting, while the ECB Executive Board member Sabine Lautenschlager speaks at a conference
• As for the rest of the week, on Tuesday, the spotlight will be the RBA monetary policy meeting. At their last meeting, Bank officials decided to hold rates unchanged as expected, and maintained their neutral stance. They seemed relatively content with the softening conditions in China and the global equity market volatility. The global concerns have eased somewhat since then and given that last month they gave the impression that they are unlikely to lower rates in the near future, no action should be expected at this meeting. However, a couple of weeks ago, the country’s largest lenders decided to raise their mortgage rates. These moves, which tantamount to monetary tightening, could increase the pressure on RBA to cut interest rates at this meeting. Although the market expects the Bank to remain on hold once again, we believe that the probabilities for a rate cut have increased also thanks to the low CPI print since the prior meeting.
• As for the indicators, the UK construction PMI for October is forecast to have declined to 58.8 from 59.9. Given a possible decline in the manufacturing index, another decline in the construction could bring the pound under additional selling pressure and could increase speculation for a decline in the service-sector PMI due out on Wednesday. The US factory orders for September are also to be released and overnight we get New Zealand’s unemployment rate for Q3.
• On Wednesday, the main event will be the US ADP employment report for October, two days ahead of the NFP release. The ADP report is expected to show that the private sector gained fewer jobs in October than it did in the previous month, where the print hit the crucial 200k level. The ISM non-manufacturing PMI and the final Markit service-sector PMI, both for October, are coming out as well.
• On Thursday, the main event will be the Bank of England monetary policy meeting. With no change in policy expected, the number of dissenting votes is the key point again. The consensus is that the vote will once again be split 8-1 with Ian McCafferty to maintain his call for a rate rise. Market participants will be eager to see if McCafferty is joined by the formerly hawkish Martin Weale or Kristin Forbes, who argued that the underlying inflation should start to pick up soon and that monetary policy would need to be tightened sooner. Thursday’s meeting will also be accompanied by the BoE’s quarterly inflation report for November. Bank officials could lower their near-term GDP growth and CPI forecasts given the lower than expected preliminary GDP for Q3 and near zero inflation for most of this year. The impact on GBP, however, will highly depend on the extent of the revision and on the tone of the meeting minutes.
• On Friday, all eyes will be on the US employment report for October. The report is expected to show an increase in payrolls of 180k, up from 142k in September. Even though the figure is expected to remain below 200k, recent comments from Fed officials showed that they are comfortable with below 200k readings. Therefore, the market is likely to focus more on the unemployment rate and average weekly earnings. The unemployment rate is expected to have remained unchanged at 5.1%. The average hourly earnings will be important as well. We need to see strong wage growth to assume that the labour market has indeed strengthened at the point it would support a Fed lift-off.
The Market
EUR/USD hits resistance slightly below 1.1085
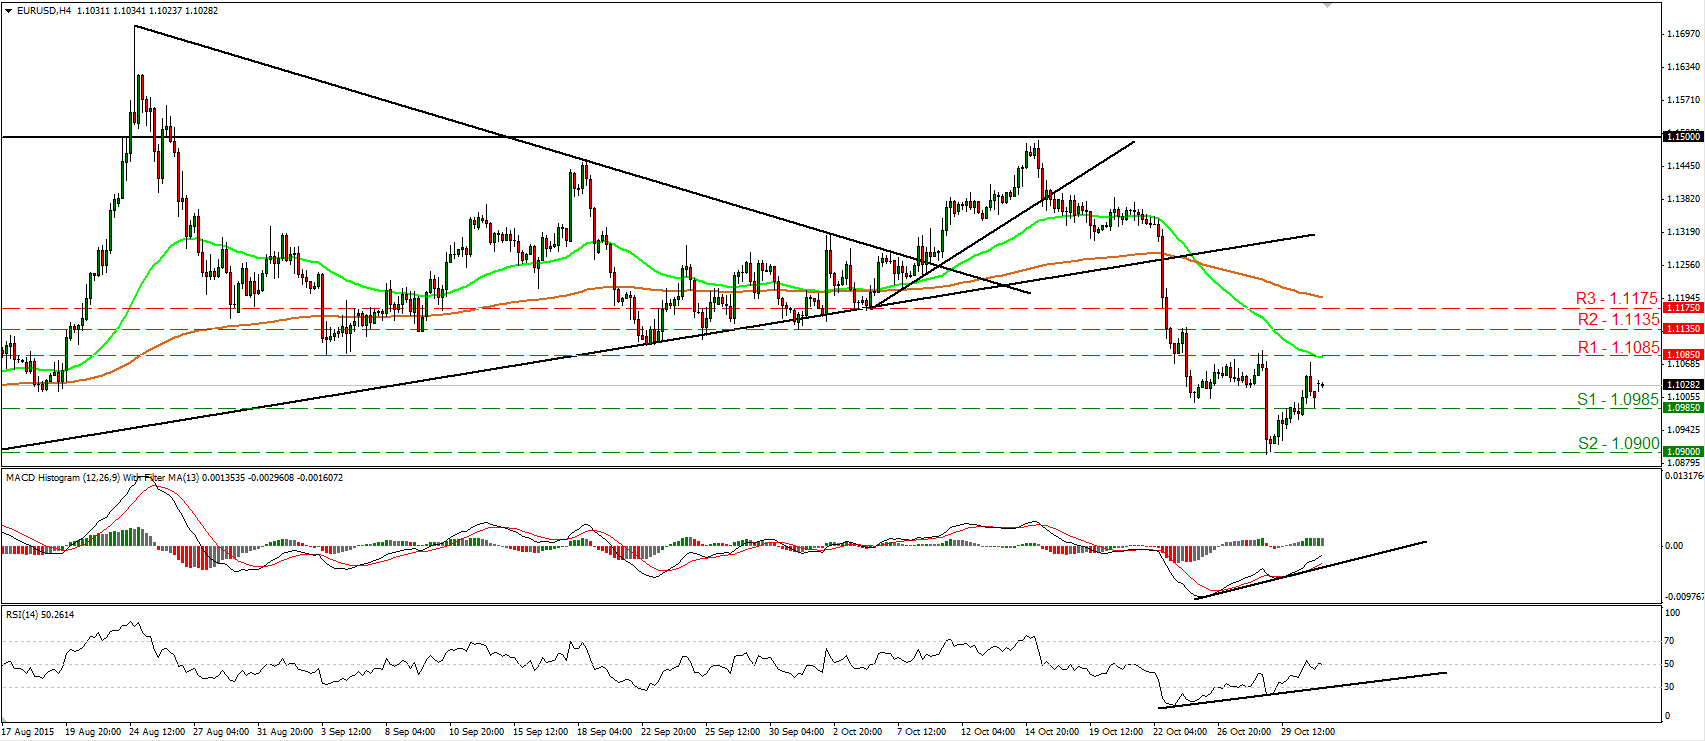
• EUR/USD continued higher on Friday, but hit resistance slightly below 1.1085 (R1) and then retreated to find support at 1.0985 (S1). Today, the pair gapped higher and during the early European morning it consolidates around 1.1030. The price structure on the 4-hour chart still suggests a short-term downtrend, and therefore, I would expect the bears to regain control at some point and drive the battle lower. A clear move below 1.0985 (S1) is likely to confirm the case and perhaps open the way for another test at the 1.0900 (S2) zone, defined by the low of the 28th of October. Nevertheless, taking a look at our momentum studies, I see the possibility for further rebound before the next negative leg. The RSI edged higher and managed to move above its 50 line, while the MACD, although negative, continued north above its trigger line and could be headed towards its zero line. What is more, there is still positive divergence between both these indicators and the price action. In the bigger picture, as long as EUR/USD is trading between the 1.0800 key support and the psychological zone of 1.1500, I would maintain my neutral stance as far as the overall picture is concerned. The short-term downtrend could be headed towards the lower bound of the range, but I would like to see a clear break below the 1.0800 hurdle before assuming that the longer-term trend is back to the downside.
• Support: 1.0985 (S1), 1.0900 (S2), 1.0850 (S3)
• Resistance: 1.1085 (R1), 1.1135 (R2), 1.1175 (R3)
GBP/JPY hits resistance near 187.00 ahead of the UK manufacturing PMI
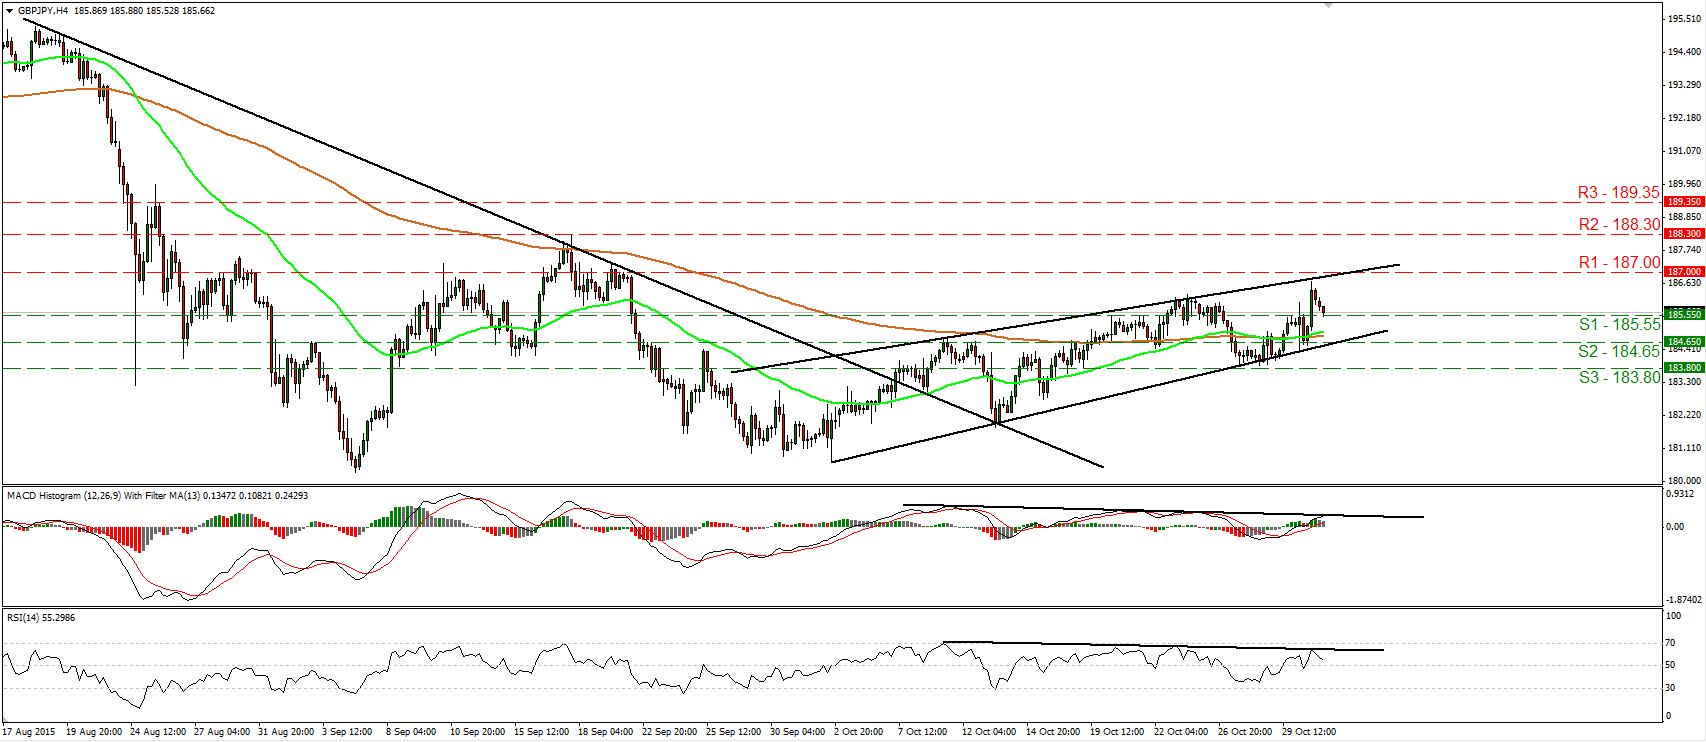
• GBP/JPY traded higher on Friday, but hit resistance marginally below the 187.00 (R1) line and then it retreated. Currently the rate is testing the 185.55 (S1) support line, where a dip is likely to aim for the next support at 184.65 (S2). Today, we get the UK manufacturing PMI for October and expectations are for the index to have declined. This could be the catalyst for a move below 185.55 (S1). Our short-term oscillators support the notion as well. The RSI turned down after it hit resistance slightly below its 70 line, while the MACD shows signs of topping slightly above its zero line. What is more, there is negative divergence between both the indicators and the price action. As for the broader trend, the completion of a double top formation on the 24th of August has turned the medium-term outlook somewhat negative. However, the fact that the rate printed a higher low on the 2nd of October makes me adopt a flat stance for now as far as the longer-term picture is concerned. • Support: 185.55 (S1), 184.65 (S2), 183.80 (S3) • Resistance: 187.00 (R1), 188.30 (R2), 189.35 (R3)
Gold continues lower
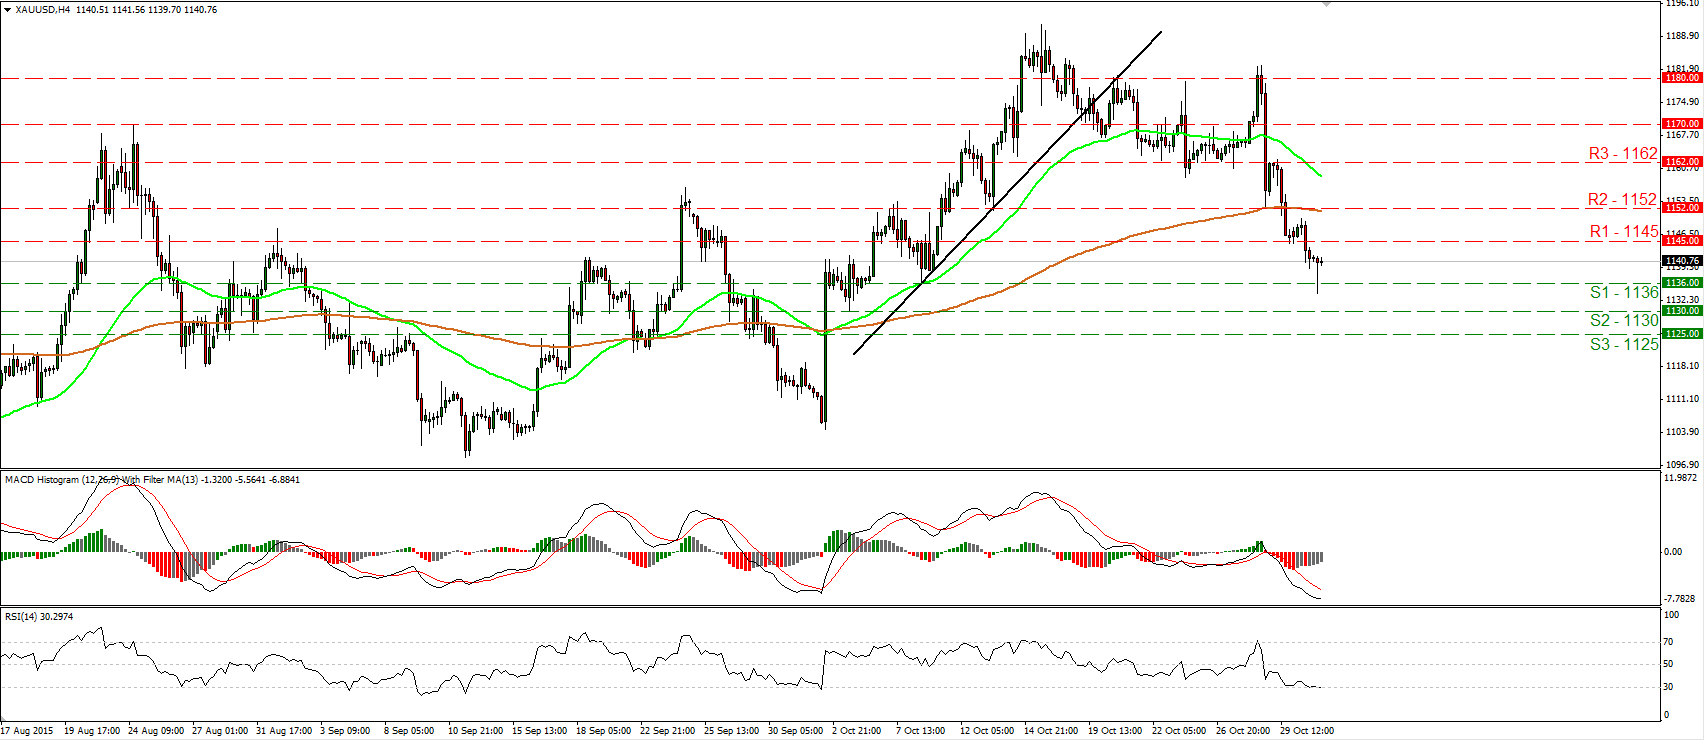
• Gold continued its slide on Friday, breaking below the support (now turned into resistance) of 1145 (R1), but today, during the Asian morning, the decline was stopped a couple of dollars below the 1136 (S1) barrier. The short-term trend remains negative in my view and I would expect another attempt below 1136 (S1) to prompt extensions towards our next support of 1130 (S2). Taking into account our short-term oscillators though, I see signs that a corrective bounce could be in the works before sellers decide to shoot again. The RSI stands near its 30 line and points sideways, while the MACD, although negative, shows signs of bottoming. On the daily chart, the medium-term outlook is still cautiously positive. As a result, I would consider the retreat started on the 15th of October as a corrective phase, at least for now.
• Support: 1136 (S1), 1130 (S2), 1125 (S3)
• Resistance: 1145 (R1), 1165 (R2), 1162 (R3)
DAX futures consolidate slightly below 10880
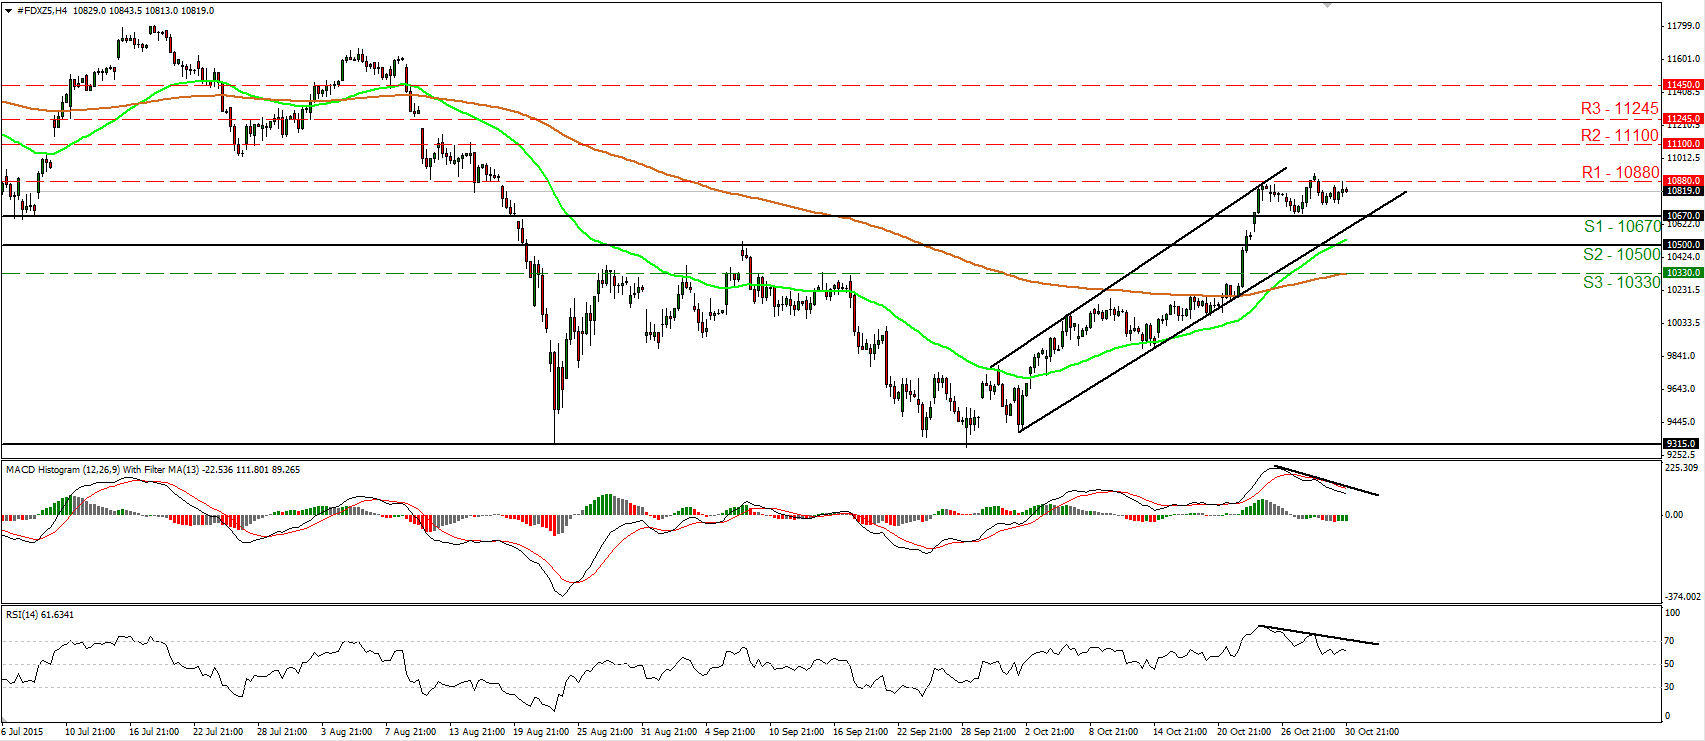
• DAX futures traded in a quiet mode on Friday, staying slightly below the resistance hurdle of 10880 (R1). As long as the index is trading within the short-term upside channel that had been containing the price action since the 30th of September, I would consider the near-term path to stay positive. Thus, I would expect another try to break above the 10880 (R1) barrier to pull the trigger for the next resistance territory of 11100 (R2). Nonetheless, our short-term momentum studies reveal weakening momentum and give evidence that further consolidation or a minor setback could be looming before the bulls seize control again. The RSI edged down after exiting its overbought territory, while the MACD, although positive, stands below its trigger line and points south. There is also negative divergence between both these indicators and the price action. On the daily chart, the break above the psychological zone of 10500 (S2) signaled the completion of a possible double bottom formation. Moreover, on the 23rd of October, buyers managed to overcome the key obstacle of 10670 (S1). These technical signs support that the index is likely to continue trading higher in the foreseeable future.
• Support: 10670 (S1), 10500 (S2), 10330 (S3)
• Resistance: 10880 (R1), 11100 (R2), 11245 (R3)
AUD/USD continues higher but stays in a downtrend
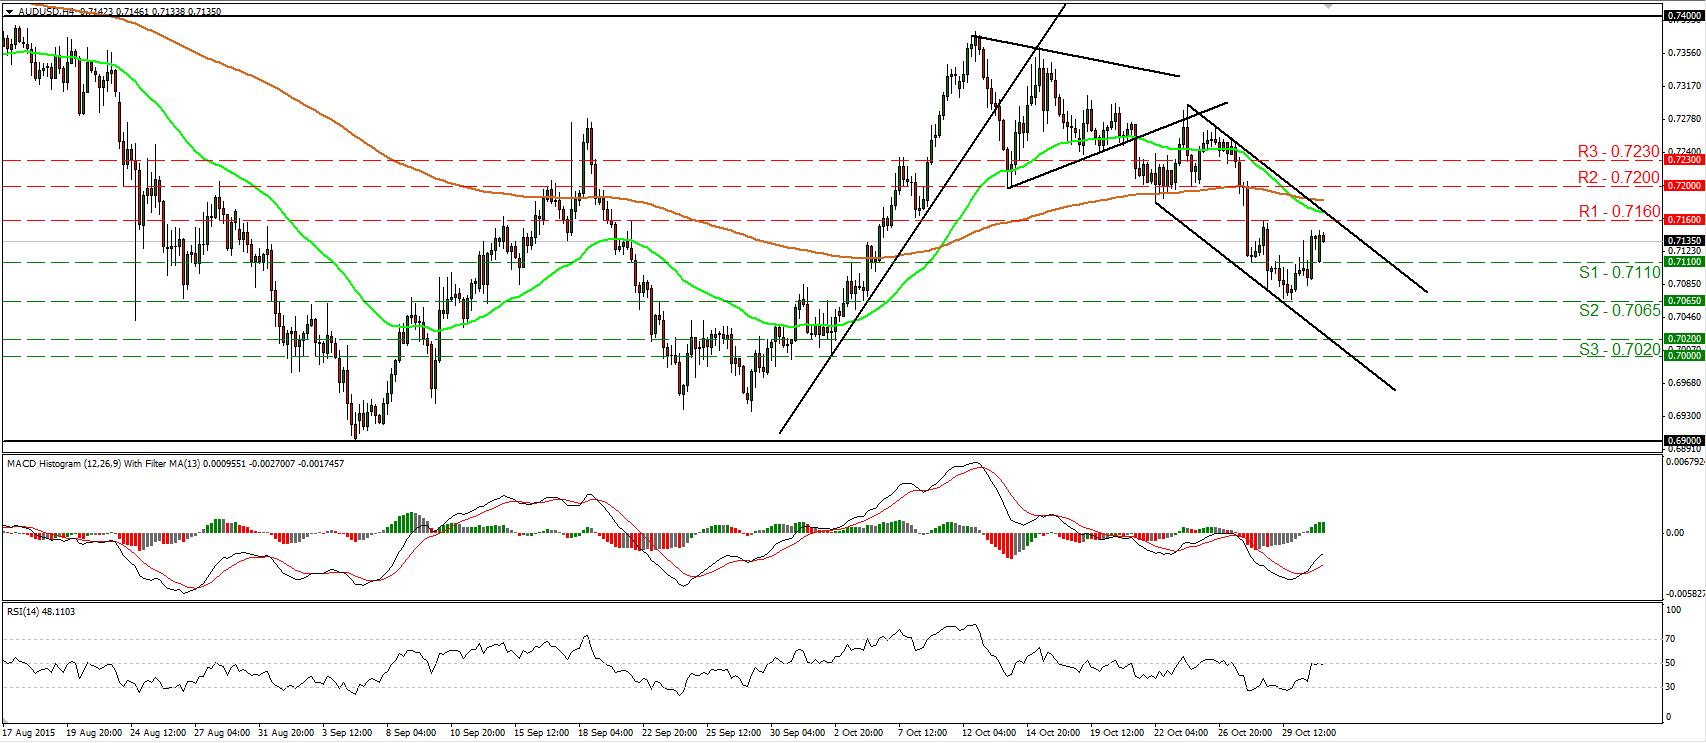
• AUD/USD continued trading higher on Friday, but the advance was halted below our resistance barrier of 0.7160 (R1). The price structure on the 4-hour chart remains lower peaks and lower troughs within a downside channel. As a result, even though the rebound may continue a bit more, I would expect sellers to take the reins and push the rate lower. A break below 0.7110 (S1) could reaffirm the case and perhaps open the way for another test at 0.7065 (S2). The RSI hit resistance at its 50 line and turned sideways, while the MACD, already negative, shows signs that it could start topping. On the daily chart, I see that AUD/USD oscillates between 0.6900 and 0.7400 since mid-July. As a result, I would hold a flat stance for now as far as the broader trend is concerned.
• Support: 0.7110 (S1), 0.7065 (S2), 0.7020 (S3)
• Resistance: 0.7160 (R1), 0.7200 (R2), 0.7230 (R3)

