
Chinese equities have, for much of this year, led this year’s broad-based rise in global stocks. But then the Trump administration decided to play hardball this month on trade—a decision that’s reshuffled year-to-date leadership for equities, based on the world’s major regions and markets via a set of publicly traded funds.
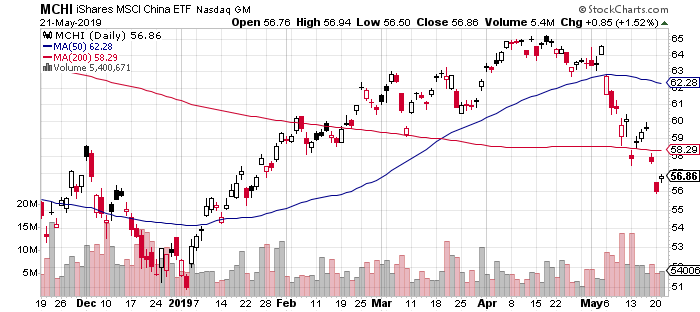
All the key slices of global stocks are still firmly in positive territory on a year-to-date basis, but China’s shares are no longer leading the crowd (as they were, by a wide margin, a month ago). The recent slide in iShares MSCI China (MCHI) has left US shares in the top spot for results this year through May 21.
SPDR S&P 500 (NYSE:SPY), a broad measure of US stocks, is up 15.2% year to date. That’s well ahead of the 8.1% return so far in 2019 for iShares MSCI China (MCHI).
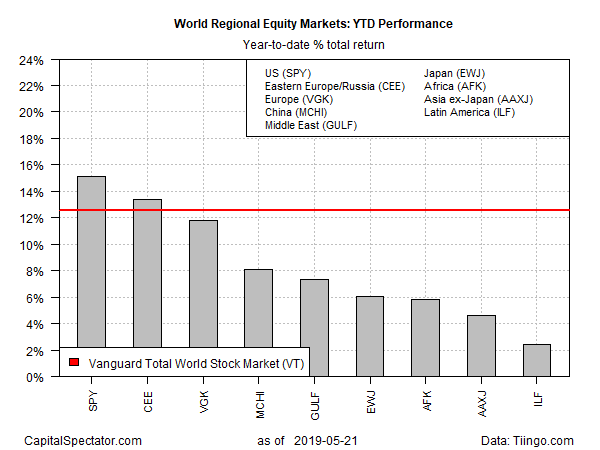
The downshift in Chinese stocks in recent weeks has also taken a toll on this market vis-a-vis a global benchmark for equities. The Vanguard Total World Stock (VT) is currently up 12.5% year to date, well ahead of MCHI’s 8.1% rise.
The prospects appear dim at the moment for a quick resolution to the US-China trade battle, based on comments by China’s president, Xi Jinping. The South China Morning Post reported yesterday:
Chinese President Xi Jinping has called for the nation to embark on a new Long March and “start all over again”, in the most dramatic sign to date that Beijing has given up hope of reaching a trade deal with the United States in the near term.
Profiling the funds listed above based on momentum shows that trending behavior has weakened overall via two sets of moving averages. The first definition compares the 10-day moving with the 100-day average, a measure of short-term trending behavior (red line in chart below). A second set of moving averages (50 and 200 days) offers an intermediate measure of the trend (blue line). The indexes range from 0 (all funds trending down) to 1.0 (all funds trending up). Based on this data through yesterday’s close, the recent dominance of bullish momentum has peaked, or so it appears via the short-term momentum index’s sharp decline below its intermediate counterpart.