PBoC cut rate and RRR
As expected the People’s Bank of China further eased its monetary policy as it proceeded with another cut in the 1-year lending rate and the reserve requirement ratio. The first one was trimmed by 25bps to 4.35%, while the ladder was cut by 50bps to 17.50%. The market’s initial response was to send global equities substantially higher. However, the rally did not last long as market participants also interpret this as a sign of weakness from the world’s second biggest economy. China is still adapting toward its “new norm” and we believe that additional rounds of stimulus are necessary to cushion the hard lending. On the FX front, the constant pressure on USD/CNY suggests that the PBoC is continuing to sell its foreign exchange reserves. The strong rumours surrounding the inclusion of the renminbi in the currency basket for the valuation of the SDRs of the IMFs also provide strong support to the Chinese currency.
New Zealand’s trade balance ahead of RBNZ decision
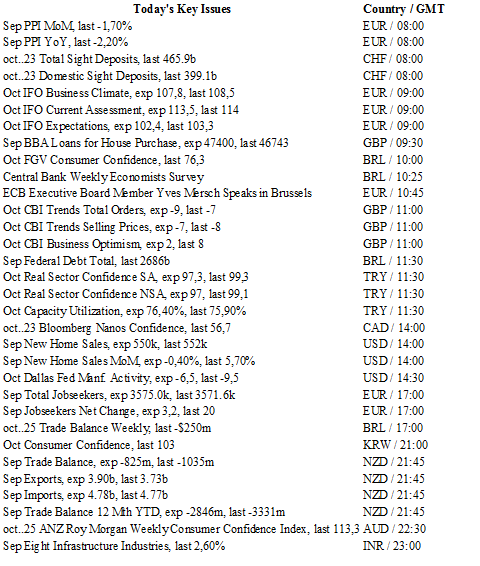
The Kiwi trade deficit is expected to have narrowed in September after printing a 6-year record last month. Exports are expected to have risen to NZ$3.90bn, helped by rising global dairy prices, compared with a reading of NZ$3.73bn the previous month. The market anticipates imports to have increased slightly to NZ$4.78bn from NZ$4.77bn in August. In spite of a temporary improvement of global dairy prices in September, prices fell unexpectedly last week. It increasingly appears that the market overestimated the resilience of the kiwi economy against global headwinds. The recent improvement of the economic outlook will prove to be short-lived and we anticipate the RBNZ to deliver a dovish message on Wednesday, arguing for a weaker NZD. From our standpoint, the risk in NZD/USD remains to the downside and we see the $0.6619 support as the next target.
French total jobseekers
Over the last seven years, the situation in the Eurozone is becoming more difficult. France is not an exception in the continent and the total number of French Jobseekers has increased by more than 80%. In 2008 around 2 million people were actively looking for a job while it currently holds above 3.5 million. Today’s data are expected to see a net change of 3000 more person. Air France, Fram (the travel agencies) are symbols of the problems. Those companies are either closing (Fram) or restructuring (Air France (PA:AIRF)).
We believe that the ongoing trend of increasing jobseekers is not going to stop. France is still paying the price of the deindustrialization. Its trade deficit remain very large at around 3€ billion. Plus, the inability to debase its currency to be more competitive only paves the way to more austerity policies. Symbol of those difficulties, the French debt-to-GDP ratio is exploding. Officials were saying that such an economy was not sustainable with a ration above 90%. Now that the French ratio is way above this threshold, we can wonder about the good health of its economy. Over the long haul, we remain bearish on the single currency.


The Risk Today
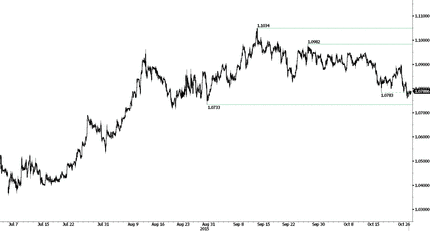
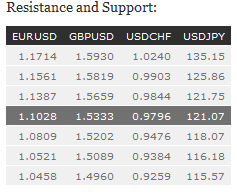
EUR/USD has declined sharply and is now bouncing back after breaking 1.1000. Hourly resistance is given at 1.1387 (20/10/2015 low). Stronger resistance can be found at 1.1561 (26/08/2015 low). Expected retracement of the pair. Since March 2015, the pair is improving. Key supports can be found at 1.0458 (16/03/2015 low) and 1.0000 (psychological support). The technical structure favours an eventual break higher. Strong resistance is given at 1.1871(12/01/2015)
GBP/USD is consolidating. Support lies at 1.5202 (13/10/2015 low) and hourly resistance can be found at 1.5529 (18/09/2015 high). A long as prices remain in this range, there is no clear mid-term momentum. Expected increase towards resistance at 1.5529. In the longer term, the technical structure looks like a recovery as long as support given at 1.5089 stands. A full retracement of the 2013-2014 rise is expected.
USD/JPY is bouncing back. The pair is now targeting strong resistance is given at 121.75 (28/08/2015 high). Hourly support still lies at found at 118.07 (15/10/2015 low). A long-term bullish bias is favored as long as the strong support at 115.57 (16/12/2014 low) holds. A gradual rise towards the major resistance at 135.15 (01/02/2002 high) is favored. A key support can be found at 116.18 (24/08/2015 low).
USD/CHF has broken resistance at 0.9740 (07/10/2015 low) before bouncing back on the resistance implied by the downward trend-line. Hourly support is given at 0.9476 (15/10/2015 low). Further bouncing is expected. In the long-term, the pair has broken resistance at 0.9448 suggesting the end of the downtrend. This reinstates the bullish trend. Key support can be found 0.8986 (30/01/2015 low).

