
Key Technical Themes:
* Elliot Wave analysis shows Aussie just completed wave-B up (blue) and is currently in wave-i down (gray) of overall wave-C down (blue) – This implies a move towards the 1.0145 prior low (at minimum) should be seen over the coming sessions
* Saw an RSI Bearish Divergence into the 1.0375/80 highs
* Formed a Shooting Star into the highs which was then followed by a Bearish Engulfing pattern shortly thereafter – These candlesticks imply further downside is ahead
* Price remains temporarily supported by the hourly 144 & 169 EMA’s, however while below 13-hour sma the bias remains lower as it should cap the immediate upside
* RSI has broken below corresponding trendline support IN ADVANCE to price (Leading Indicator)
* Sees trendline support from the Jan. 9th low near 1.0305
Ultimately, I’ll continue to look to fade any remaining Aussie strength as long as AUD/USD remains below the key 200-day sma and 61.8% retracement (using the July high & Oct. low) at 1.0415 and 1.0435 respectively.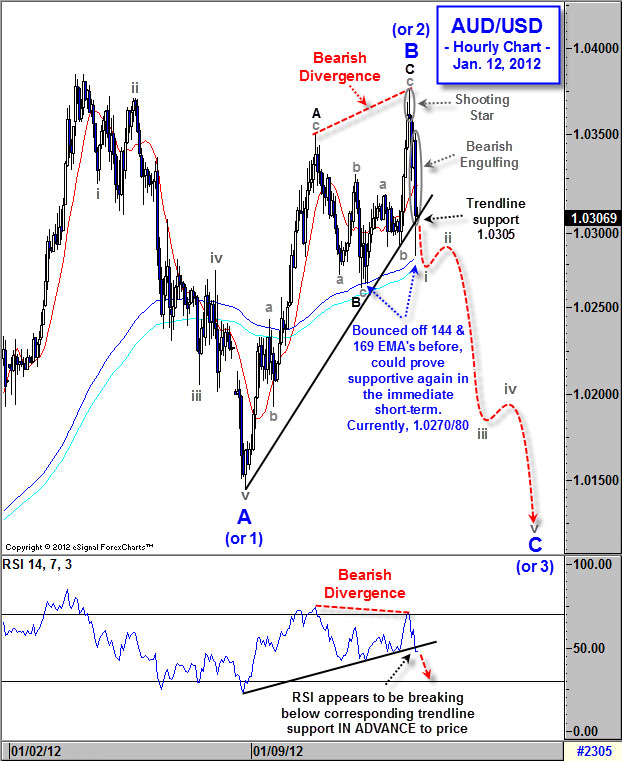 AUD/USD Daily" title="AUD/USD Daily" width="622" height="761">
- English (UK)
- English (India)
- English (Canada)
- English (Australia)
- English (South Africa)
- English (Philippines)
- English (Nigeria)
- Deutsch
- Español (España)
- Español (México)
- Français
- Italiano
- Nederlands
- Português (Portugal)
- Polski
- Português (Brasil)
- Русский
- Türkçe
- العربية
- Ελληνικά
- Svenska
- Suomi
- עברית
- 日本語
- 한국어
- 简体中文
- 繁體中文
- Bahasa Indonesia
- Bahasa Melayu
- ไทย
- Tiếng Việt
- हिंदी
Chart to Watch: AUD/USD – Ominous Signs Could Drag the Aussie Down Under
Published 01/12/2012, 11:13 PM
Updated 05/18/2020, 08:00 AM
Chart to Watch: AUD/USD – Ominous Signs Could Drag the Aussie Down Under
Latest comments
Loading next article…
Install Our App
Risk Disclosure: Trading in financial instruments and/or cryptocurrencies involves high risks including the risk of losing some, or all, of your investment amount, and may not be suitable for all investors. Prices of cryptocurrencies are extremely volatile and may be affected by external factors such as financial, regulatory or political events. Trading on margin increases the financial risks.
Before deciding to trade in financial instrument or cryptocurrencies you should be fully informed of the risks and costs associated with trading the financial markets, carefully consider your investment objectives, level of experience, and risk appetite, and seek professional advice where needed.
Fusion Media would like to remind you that the data contained in this website is not necessarily real-time nor accurate. The data and prices on the website are not necessarily provided by any market or exchange, but may be provided by market makers, and so prices may not be accurate and may differ from the actual price at any given market, meaning prices are indicative and not appropriate for trading purposes. Fusion Media and any provider of the data contained in this website will not accept liability for any loss or damage as a result of your trading, or your reliance on the information contained within this website.
It is prohibited to use, store, reproduce, display, modify, transmit or distribute the data contained in this website without the explicit prior written permission of Fusion Media and/or the data provider. All intellectual property rights are reserved by the providers and/or the exchange providing the data contained in this website.
Fusion Media may be compensated by the advertisers that appear on the website, based on your interaction with the advertisements or advertisers.
© 2007-2024 - Fusion Media Limited. All Rights Reserved.