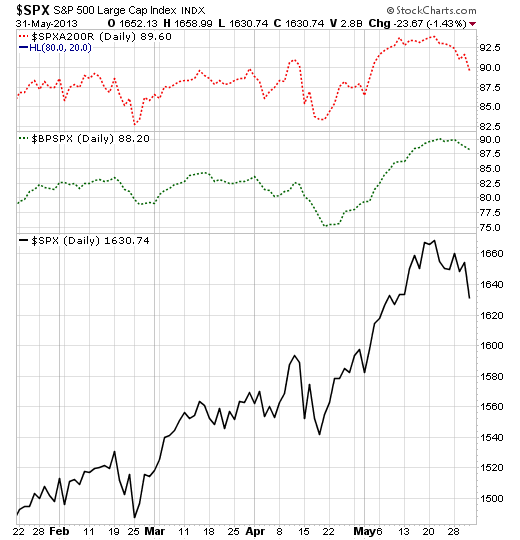
The negative action in stocks this past week is a stark contrast to the long positive stretch so far this year. Even though the week was uncomfortable, the percent of S&P 500 stocks above their 200-day average is still high at 90%, and the percentage of stocks in bullish point and figure chart patterns is still high at 88%.
Here is how various representative asset categories have performed year-to-date.
Each chart plots the security (or index) in black. The 63-day price channel high, low and mid-point are plotted in blue. The 200-day moving average is plotted in solid tan. The price levels that are 10% and 20% below the trailing 252-day high price (correction and bear market levels) are plotted in red.
For bonds, corrections and bear markets are characterized by less severe drawdowns, however, for visual consistency, the charts below use the 10% and 20% trailing indicators on stocks as well as bonds.
S&P 500
Europe (IEV)
Japan (EWJ)
Emerging Markets (EEM)
Australia (EWA)
China (FXI)
Brazil (EWZ)
S&P High Yield Dividend Aristocrats (SDY)
S&P 500 Low Volatility (SPLV)
S&P 500 High Quality (SPHQ)
S&P 500 Utilities (XLU)
MSCI Equity REITs (VNQ)
Alerian MLPs (AMJ)
Short-Term Investment Grade Corporate Bonds (VCSH)
Intermediate-Term Investment Grade Corporate Bonds (BIV)
Long-Term Investment Grade Corporate Bonds (VCLT)
Emerging Market Dollar Denominated Sovereign Bonds
Non-US Developed Market Sovereign Bonds (BWX)
Gold Bullion (GLD)
Copper (JJC)
- English (UK)
- English (India)
- English (Canada)
- English (Australia)
- English (South Africa)
- English (Philippines)
- English (Nigeria)
- Deutsch
- Español (España)
- Español (México)
- Français
- Italiano
- Nederlands
- Português (Portugal)
- Polski
- Português (Brasil)
- Русский
- Türkçe
- العربية
- Ελληνικά
- Svenska
- Suomi
- עברית
- 日本語
- 한국어
- 简体中文
- 繁體中文
- Bahasa Indonesia
- Bahasa Melayu
- ไทย
- Tiếng Việt
- हिंदी
Chart Survey Of Representative Asset Types After Difficult Market Week
Published 06/02/2013, 04:31 AM
Updated 07/09/2023, 06:31 AM
Chart Survey Of Representative Asset Types After Difficult Market Week
Latest comments
Install Our App
Risk Disclosure: Trading in financial instruments and/or cryptocurrencies involves high risks including the risk of losing some, or all, of your investment amount, and may not be suitable for all investors. Prices of cryptocurrencies are extremely volatile and may be affected by external factors such as financial, regulatory or political events. Trading on margin increases the financial risks.
Before deciding to trade in financial instrument or cryptocurrencies you should be fully informed of the risks and costs associated with trading the financial markets, carefully consider your investment objectives, level of experience, and risk appetite, and seek professional advice where needed.
Fusion Media would like to remind you that the data contained in this website is not necessarily real-time nor accurate. The data and prices on the website are not necessarily provided by any market or exchange, but may be provided by market makers, and so prices may not be accurate and may differ from the actual price at any given market, meaning prices are indicative and not appropriate for trading purposes. Fusion Media and any provider of the data contained in this website will not accept liability for any loss or damage as a result of your trading, or your reliance on the information contained within this website.
It is prohibited to use, store, reproduce, display, modify, transmit or distribute the data contained in this website without the explicit prior written permission of Fusion Media and/or the data provider. All intellectual property rights are reserved by the providers and/or the exchange providing the data contained in this website.
Fusion Media may be compensated by the advertisers that appear on the website, based on your interaction with the advertisements or advertisers.
© 2007-2024 - Fusion Media Limited. All Rights Reserved.
