Market Momentum
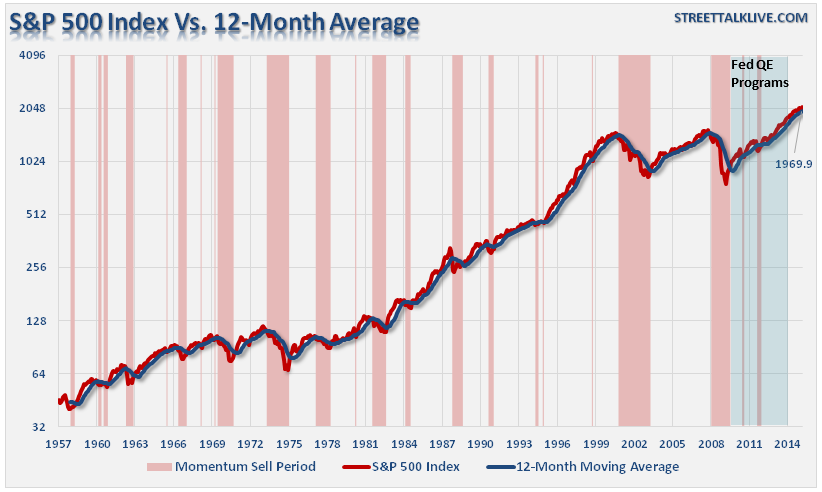
There is a fairly deep body of research that suggests that the momentum of an index, sector, or stock, over the last 12-months is indicative of performance over the next month. We can model this out fairly easily by look at the S&P 500versus its 12-month moving average as shown below.
Currently, the trend of the market remains positive with the 12-month moving average currently at 1970ish. The average will, of course, rise over the next month but it currently suggests that momentum is still favorable for the S&P 500 as a whole. The blue highlighted area denotes the ongoing Central Bank interventions which quickly reversed momentum sell signals that occurred after previous programs ended.
Currently, momentum has begun to weaken following the end of the Federal Reserve's last QE program. The question remains whether the bullish trend can remain intact given the threat of higher interest rates in the near future. Historically speaking, a tightening of monetary policy has eventually not good for either stocks or the economy. However, previously the economy was growing at 4% or greater, not 2%.
Earnings
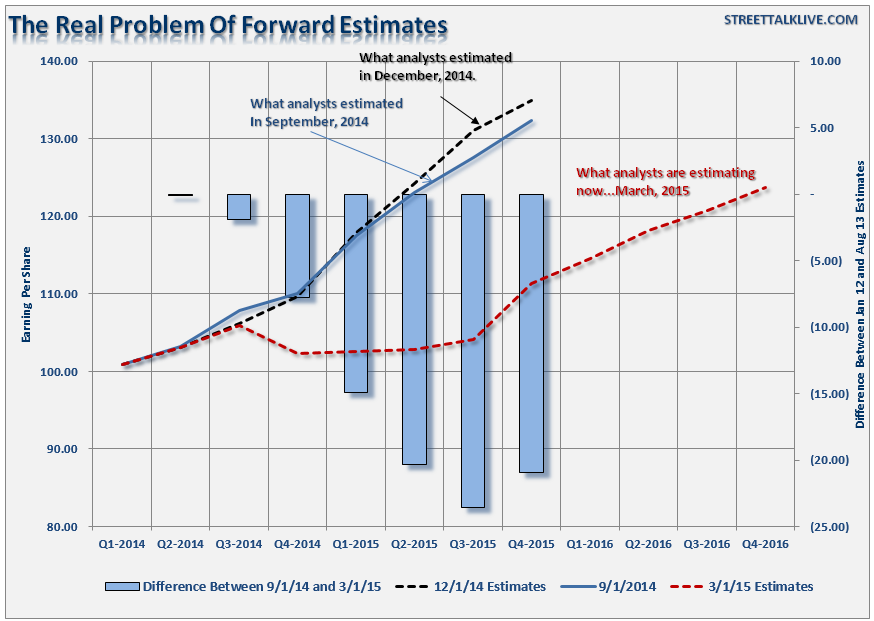
Speaking of a weaker backdrop for stocks, the deterioration in earnings is quite another factor all-together. I have not been able to do my quarterly earnings analysis as S&P had "pulled all estimates for review" just after the beginning of the year. They have now reposted earnings with forward estimates which contain a significant downward revision.
The chart below shows where earnings were tracking in September and December of last year (blue and black lines) and where they are now after "review" by S&P.
Here is the problem with forward estimates. It is almost laughable that analysts use forward estimates to prognosticate anything. The reason is that, as clearly shown, whatever analysis was used to justify valuations four months ago, is no longer relevant. Furthermore, the continued realignment of estimates to eventual reality is the equivalent of moving the target to arrow.
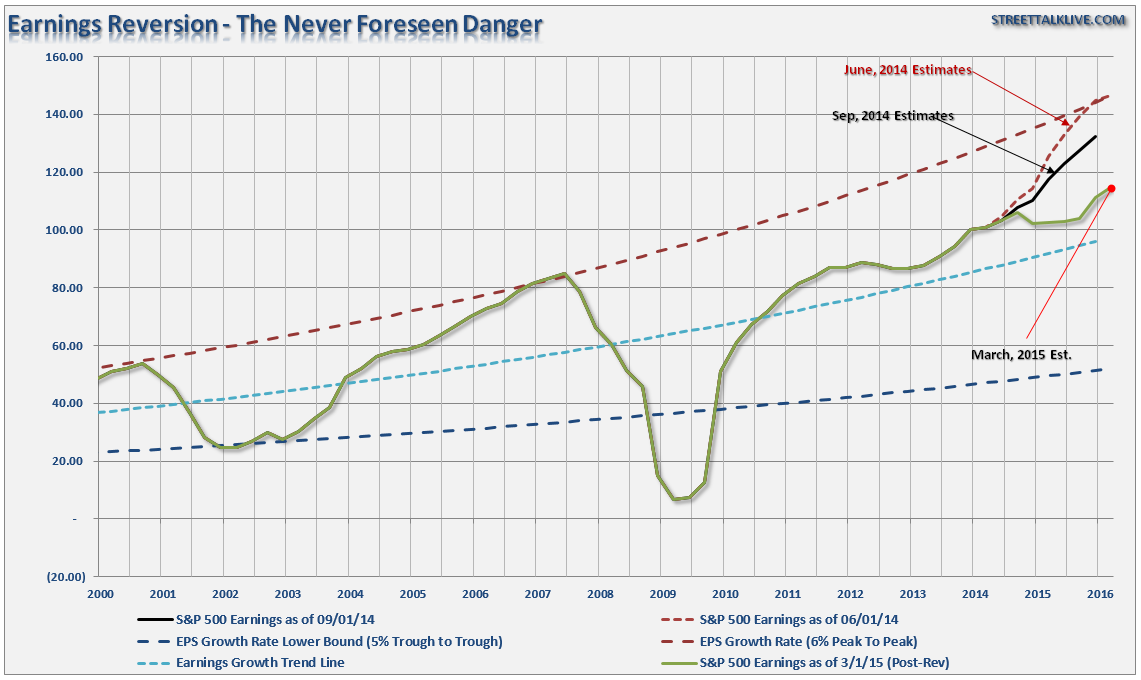
You can see the difference between what 2015 earnings estimates were in September of 2014 and where they are today. The degradation in earnings suggests that the economy is substantially weaker than market prices currently suggest. The chart below shows the deterioration in earnings estimates since June of 2014.
With valuations already pushing some of the highest levels in history, it is easy to suggest that forward portfolio returns will be substantially lower in the future than they have been over the past 6 years.
Oil Prices, Rig Counts and Energy Exposure
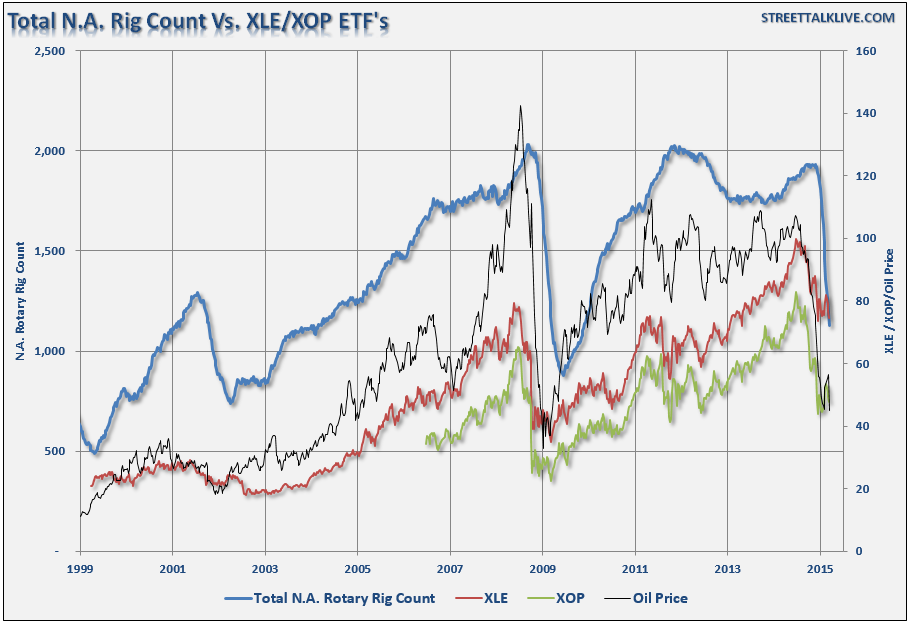
Retail investors have been piling into energy-related positions over the last couple of months hoping that the sell-off in oil prices was over. This is not likely the case as of yet particularly as the energy complex approaches their next major hurdle which is insufficient storage capacity.
The chart below shows the decline in rig counts versus oil prices and energy-related exposure as represented by (ARCA:XLE) (refiners) and (NYSE:XOP) (drillers.)
The decline in rig count is likely to continue as production slows particularly as the ability to store oil becomes an issue. This will lead to a further deterioration in earnings in the energy space, reduce CAPEX spending and increased employment reductions.
The negative impacts to economic growth will also be felt as employment is reduced in other "related" areas of the economy particularly in the service and transportation sectors.
The recent bounce in oil prices, and chase by investors, is likely over for now. There is still a fairly large amount of unwinding that needs to occur before the energy completed its reversion to more normal operating metrics.
Employment Not What It Seems
The recent "blowout" employment report sent speculation running wild that the economy was clearly so strong that wages would now have to rise, consumer spending would surge, and the Fed would clearly have to raise interest rates.
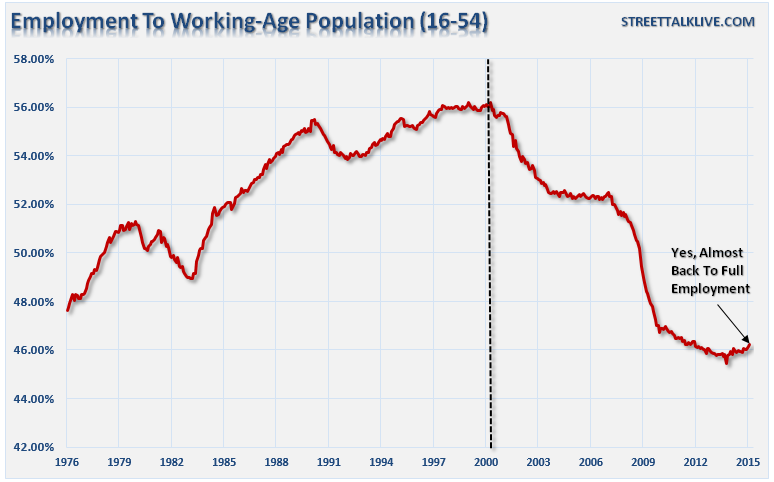
However, as shown by the recent retail sales report, spending isn't rising (even with low gas prices) as wage growth remains stagnant overall. The primary issue with the employment report remains that the employment-to-population ratio of those between the ages of 16-54 has barely recovered from its lows and remains at a level lower than during the financial crisis.
Since this group excludes all those of "baby-boomer" and "retirement" age, it gives a clearer picture about what is actually happening within the economy.
While there has clearly been some modest improvement in the overall ratio, it is still a long way from suggesting that the economy is creating the kinds of jobs necessary to facilitate strong wage gains and consumptive spending. This is particularly the case for the group of individuals that are already heavily indebted with little or no savings.
Margin Debt, High Yield Bonds and Stocks
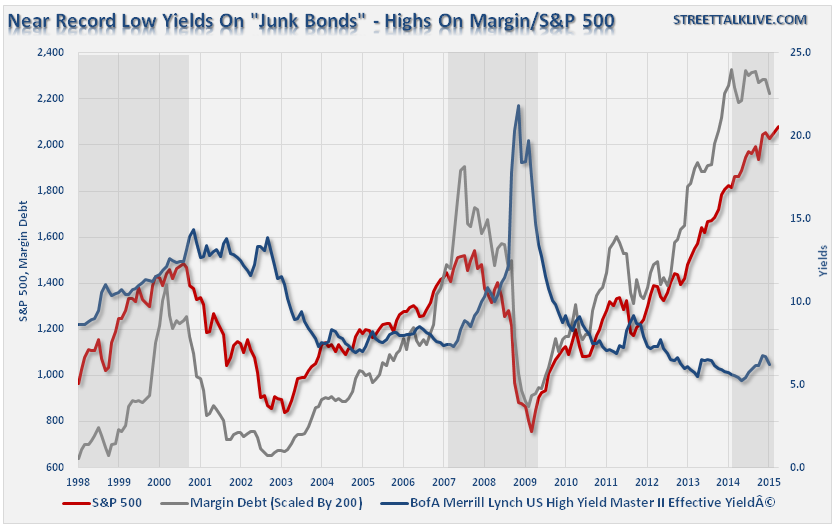
The recent spike in high-yield (aka junk) bonds looks to be over as investors are once again speculating that the current "bull market" will continue on the back of the ECB's ongoing QE program.
As shown below, the yield on "junk bonds" has once again turned down suggesting that "risk mode" has been turned back on after the recent liquidation earlier this year.
Importantly, however, is to note that margin debt has started to decline. Rising levels of margin debt are a beneficial support to rising asset prices as it increases overall liquidity. Falling levels of margin debt extract liquidity from the markets and have typically been associated with markets near intermediate or longer term peaks.
What this suggests is that while "retail" investors are loading up on "junk bonds" and "more risky stocks," small and mid-capitalization, it is the professionals that are gladly unloading positions to them.
Conclusion
The overall economic data has been significantly weaker than expected as of late, and it now looks like Q1-GDP will print somewhere below 2%. The strong dollar is negatively impacting corporate earnings as exports are hit, and there is early evidence that the ECB's QE program will not likely be the success that many had hoped for.
As stated previously, with market momentum now waning a bit of caution in relation to portfolio exposure seems prudent. But then again, being prudent seems a bit ridiculous in a market that has been quoted as one that "can't go down." Of course, that has always been the case, just before it has.

