The safety of Tesla’s autopilot driver assistance system came into question over the weekend, after one of its S models was involved in a fatal crash in Texas on Saturday night and two people were killed. According to reports, witnesses "indicated there was nobody in the driver's seat" of the vehicle when it crashed into a tree.
An investigation into the cause of the crash is underway, but a local law enforcment official was quoted by The Wall Street Journal as saying, "we’re almost 99.9% sure,” there was no one behind the wheel at the time of the accident.
That sent Tesla (NASDAQ:TSLA) shares lower yesteday. It was the stock's worst daily selloff in nearly four months. Intraday the stock was down as much as 6.5%, but by the close, losses had been halved to 3.4%.
Tesla's highly visible and notoriously outspoken founder and CEO Elon Musk wasn't taking any of the recent events sitting down. On Sunday he tweeted: "Tesla with Autopilot engaged now approaching 10 times lower chance of accident than average vehicle."
That was followed on Monday by another tweet from Musk: “Data logs recovered so far show Autopilot was not enabled.” Texas police say they have not yet received any data log information from Tesla.
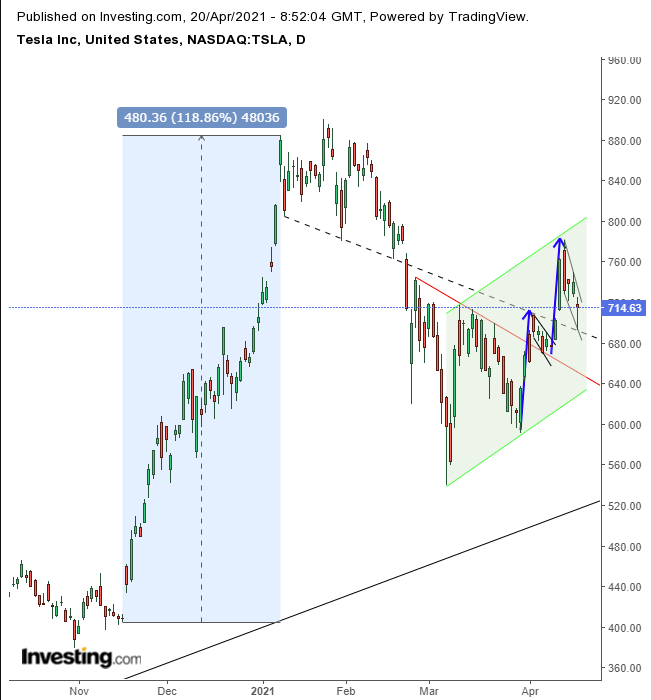
Most noteworthy to us, from a market perspective, is that despite the devastating news, the stock recovered from yesterday's intraday low ahead of the close. Moreover, its daily low was at support. Plus, the rest of the chart demonstrates the supply-demand ratio is still tilted toward buyers. As such, we continue to maintain our bullish position on TSLA.

The daily low found support precisely by the extended neckline of a H&S top completed on Feb. 22. That same support, once broken, turned into resistance and realigned with a second neckline, but this time of a H&S bottom.
That made sense after an earlier, unfathomable rally of almost 120% in a mere 12 weeks, between Nov. 16 and Jan. 8, when it became high time for profit taking. The reflation trade, favoring value over growth stocks, egged traders on in a race to see who could lock in profits more quickly, ahead of prices falling further, creating a self-fulfilling cycle. Therefore, the H&S top sloped downward, as there was insufficient demand but too much supply. As such the pattern was unable to create a strong right shoulder.
Conversely, in the H&S bottom, the same down sloping neckline is a sign of strength, as it indicates buyers sucked up all the available supply and ravenously demanded more, causing prices to vault higher before they could form a proper right shoulder. In economics, as in nature, the pendulum swings back with the same force it initially used. Since the selloff was driven by panic, demand on the way back was equally determined—aligning with the same neckline.
Notice though that some of the decline predated yesterday’s plunge. It was a technical correction within TSLA's brand new rising channel from the bottom, after it neared the uptrend line since the March bottom, reinforced by the 200 DMA.
Yesterday’s drop rebounded back above both the 50 and 100 DMAs, though the 100 DMA slipped below the 50 DMA, which is itself bearish. However, that's understandable given the descent, which, within the rising channel, is seen as a return-move to retest the pattern.
Despite yesterday’s selloff, the price formed a hammer, whose bullishness is compounded by it being on the extended neckline as well as on top of a previous bullish flag.
A comparison between different price averages via the MACD as well as the RSI were both within bullish formations.
To clarify, we're breaking down the technical chart, in order to try and piece together the puzzle of supply and demand. We don’t know the 'why' behind these price patterns, what drives investors to increase demand over supply from a technical perspective, but we do know the probable results on a statistical basis. Plus we can't say whether the activity is driven by inside information, informed money, smart money or mere speculation.
However, we do know that these patterns statistically follow through. That doesn’t mean they will work this time.
Plus, from a fundamental perspective, we can't know at this point what the investigations will reveal, or whether a broader tech sector selloff, following yesterday’s bearish NASDAQ pattern, will lead to another selloff. That’s why, as always, traders must operate according to a trading plan.
Trading Strategies – Long Position Setup
Conservative traders should either wait for the price to successfully retest the channel bottom or complete its current flag, with the rebound at least 3% deep and lasting at least 3 days, preferably to include a weekend.
Moderate traders would also wait for the conservative choice, but woud be content with just a 2% price penetration over a 2 day period.
Aggressive traders could buy at will, provided they accept the higher risk that goes along with the higher reward of being ahead of the market. Money management is crucial.
Here’s an example:
Trade Sample
- Entry: $715
- Stop-Loss: $690
- Risk: $25
- Target: $790
- Reward: $75
- Risk:Reward Ratio: 1:3
