by Pinchas Cohen
The US Senate finally did it. It passed corporate tax legislation early Saturday morning, after markets closed. Naturally, this morning when markets opened for the week, the dollar gapped higher, as it should. Investors have been waiting for clear signs that tax reform was on its way for over a year now, ever since Donald Trump's surprising presidential election win in November 2016.
Big Jump, Shaky Gains
So why then is the dollar unable to maintain its gains? One of the current President's most anticipated fiscal policies has just moved a lot closer to becoming reality yet investors are not in agreement on the future of the USD.
If they were united, the price would climb to whatever level was considered equitable by markets and remain there, as gains were maintained. In other words, everyone would buy from the levels prior to the legislation, driving the price up, with the greenback then continuing to climb, as traders offered higher and higher bids, till willing sellers could be found. The cycle would then repeat for additional up-moves at higher offers, till the price reached whatever markets perceived was the appropriate value of the dollar.
However, that's not what happened. Instead, after the price rose on a gap this morning, if fluctuated, making higher highs, as well as lower lows. It finally setted near the opening price.
Bearish High-Wave Candle Signals Lack of Leadership
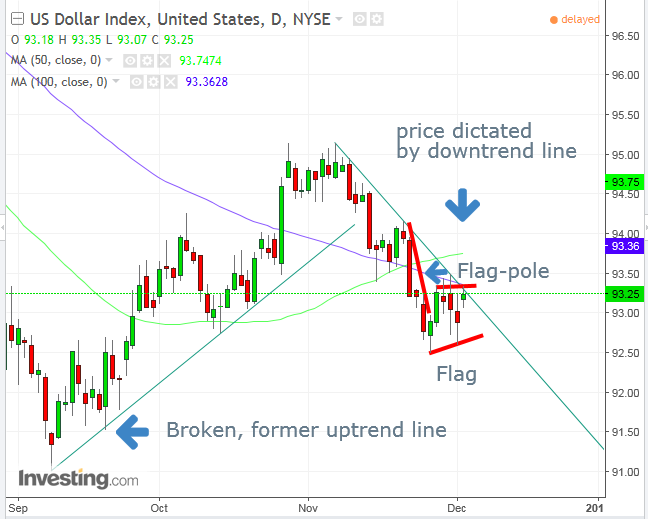
This up and down movement with no actual change formed a bearish High-Wave candle. Such price action is typical of lack of leadership. It means that either equally divided opposing forces or fickle traders are driving this trade. This candle generally develops before a reversal.
If we cross-reference the High-Wave candle with other technical factors, we would notice that it also climbed above, but settled below, its uptrend line since November 7, compounding the resistance presumed by expected supply. As well, the price just about reached the 100 dma (purple), before it retreated, adding a third component for resistance. Finally, the greenback reached the top of its trading range since last Tuesday.
Not only does one expect supply at the top of the range—after the 0.92 percent decline since November 30 from 93.50 to Friday's 92.60 low—but this trading range is part of a bearish, rising flag. The pattern started on November 21, with a sharp, 1.75 percent 5-day decline, forming the "flag pole."
The trading range that followed reflects a period of profit-taking and reevaluation of the trend. The downside breakout of the flag would signal a resumption of the prior trend. The fact that the corporate tax cut legislation, one of the best pieces of news for dollar traders, didn't blow through the bearish flag with a decisive upside breakout, doesn't bode well for the greenback's further rise.
A divergent technical occurrence is the 50 dma (green) that crossed above the falling 100 dma, which demonstrates that recent price data is rising relative to older price data, potentially forming an upward momentum.
Trading Strategies
Conservative traders would wait on entering a short position for a decisive downside breakout, followed by a return move to retest the pattern's integrity, confirmed by a down day that covers the preceding up day.
Moderate traders may wait on a short position for a downside breakout, with the option waiting for the return move, depending their risk aversion.
Aggressive traders may enter a short now, counting on the assorted technical signals: the downtrend line, the range top, the flag that's forming and the 100 dma. A stop loss may be entered above the November 30, 93.50 high, with a minimum target of the flag bottom of 92.75, for a 1:2 risk-reward ratio. A target of 92.50 is required for the 1:3 risk-ratio.
Minimum Pattern Target: 91.08
The minimum target measure is the length of the pole, from the November 21, 94.17 high, to the November 27, 92.50 low, equaling 1.67 from the point of breakout. Based on the angle of the bottom of the flag, let's assume a breakout from 92.75, minus 1.67 equals 91.08
Naturally, a trader may include this target price when entering a trade inside the flag, providing they can stomach the fluctuation until and during the breakout.

